文件:DensificationLaw.png
本预览的尺寸:591×600像素。 其他分辨率:237×240像素 | 1,088×1,104像素。
原始文件 (1,088 × 1,104像素,文件大小:195 KB,MIME类型:image/png)
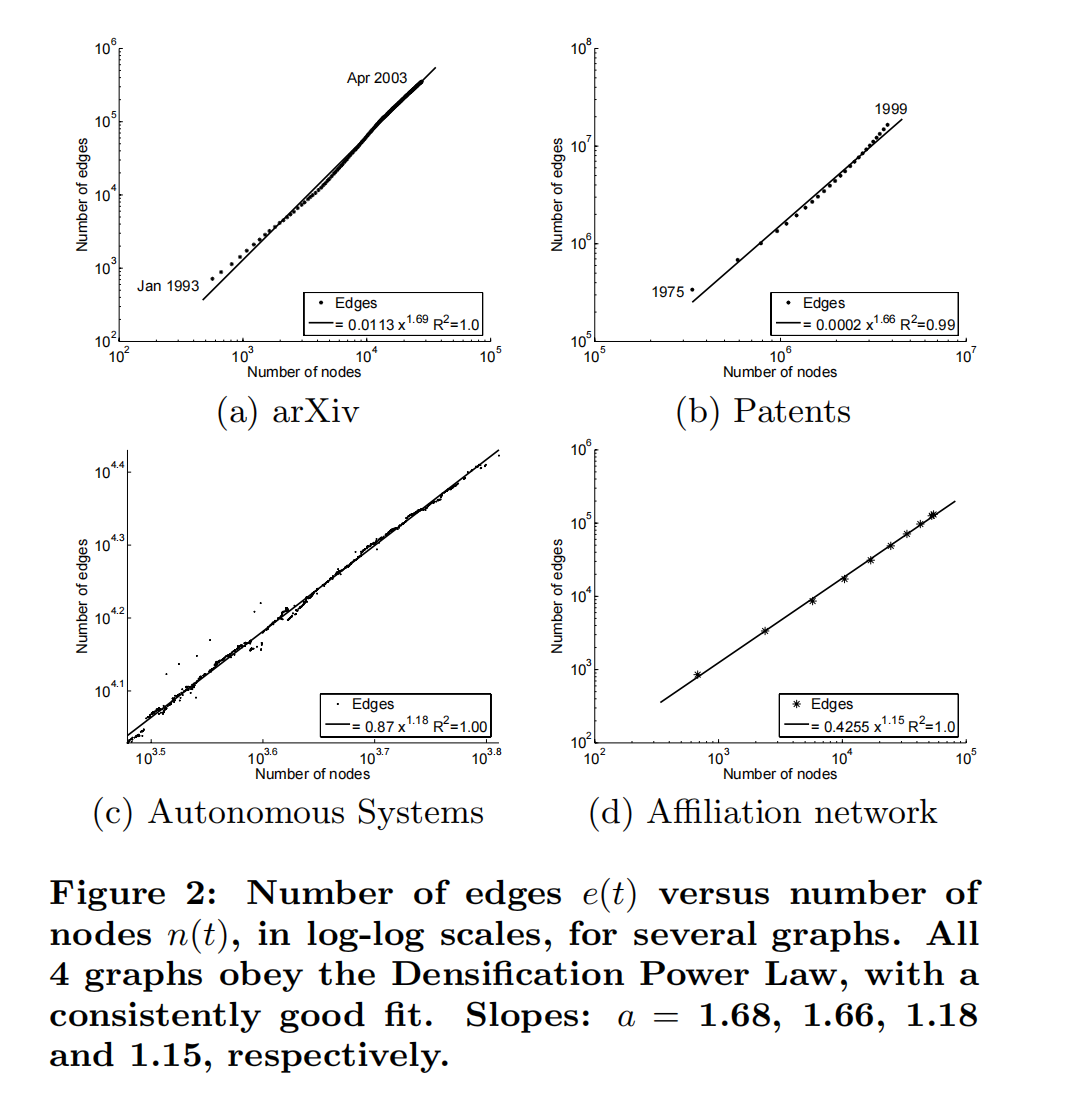
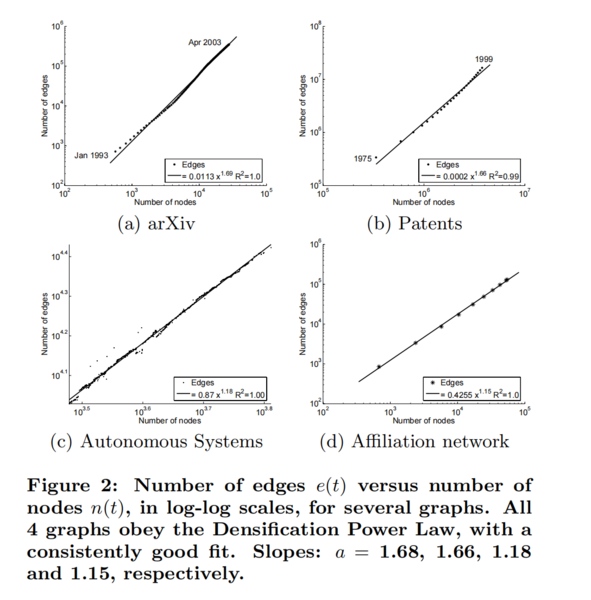
Figure 2: Number of edges e(t) versus number of nodes n(t), in log-log scales, for several graphs. All 4 graphs obey the Densification Power Law, with a consistently good fit. Slopes: a = 1.68, 1.66, 1.18 and 1.15, respectively.
文件历史
单击某个日期/时间查看对应时刻的文件。
| 日期/时间 | 缩略图 | 大小 | 用户 | 备注 | |
|---|---|---|---|---|---|
| 当前 | 2025年11月2日 (日) 10:52 | | 1,088 × 1,104(195 KB) | 月亮不睡我不睡(讨论 | 贡献) |
您不可以覆盖此文件。
文件用途
以下页面使用本文件:
