分析股票价格共振网络
Thingamabob(讨论 | 贡献)2020年10月14日 (三) 20:25的版本 (创建页面,内容为“==准备一批股票数据== 先调用一些包 <syntaxhighlight lang="python"> import datetime import numpy as np import pylab as pl from matplotlib…”)
准备一批股票数据
先调用一些包
    import datetime
    import numpy as np
    import pylab as pl
    from matplotlib import finance
    from matplotlib.collections import LineCollection
    from sklearn import cluster, covariance, manifold
接着确定时间段和股票名称,使用sklearn自带的finance.quotes_historical_yahoo命令来下载数据。以下命令中带井号的是测试时发现下载有问题的。
    # ======Retrieve the data from Internet=========
    # Choose a time period reasonnably calm (not too long ago so that we get
    # high-tech firms, and before the 2008 crash)
    d1 = datetime.datetime(2003, 01, 01)
    d2 = datetime.datetime(2008, 01, 01)

    # kraft symbol has now changed from KFT to MDLZ in yahoo
    symbol_dict = {
        'TOT': 'Total',
        'XOM': 'Exxon',
        'CVX': 'Chevron',
        'COP': 'ConocoPhillips',
    #    'VLO': 'Valero Energy',
        'MSFT': 'Microsoft',
        'IBM': 'IBM',
    #    'TWX': 'Time Warner',
    #    'CMCSA': 'Comcast',
        'CVC': 'Cablevision',
        'YHOO': 'Yahoo',
    #    'DELL': 'Dell',
        'HPQ': 'HP',
        'AMZN': 'Amazon',
        'TM': 'Toyota',
        'CAJ': 'Canon',
        'MTU': 'Mitsubishi',
        'SNE': 'Sony',
        'F': 'Ford',
        'HMC': 'Honda',
        'NAV': 'Navistar',
        'NOC': 'Northrop Grumman',
        'BA': 'Boeing',
    #    'KO': 'Coca Cola',
        'MMM': '3M',
        'MCD': 'Mc Donalds',
        'PEP': 'Pepsi',
        'MDLZ': 'Kraft Foods',
    #    'K': 'Kellogg',
        'UN': 'Unilever',
        'MAR': 'Marriott',
        'PG': 'Procter Gamble',
        'CL': 'Colgate-Palmolive',
    #    'NWS': 'News Corp',
        'GE': 'General Electrics',
        'WFC': 'Wells Fargo',
        'JPM': 'JPMorgan Chase',
        'AIG': 'AIG',
        'AXP': 'American express',
        'BAC': 'Bank of America',
        'GS': 'Goldman Sachs',
        'AAPL': 'Apple',
        'SAP': 'SAP',
        'CSCO': 'Cisco',
        'TXN': 'Texas instruments',
        'XRX': 'Xerox',
        'LMT': 'Lookheed Martin',
        'WMT': 'Wal-Mart',
        'WAG': 'Walgreen',
        'HD': 'Home Depot',
        'GSK': 'GlaxoSmithKline',
        'PFE': 'Pfizer',
        'SNY': 'Sanofi-Aventis',
        'NVS': 'Novartis',
        'KMB': 'Kimberly-Clark',
        'R': 'Ryder',
        'GD': 'General Dynamics',
        'RTN': 'Raytheon',
        'CVS': 'CVS',
        'CAT': 'Caterpillar',
    #    'DD': 'DuPont de Nemours'
    }
    symbols, names = np.array(symbol_dict.items()).T
    quotes = [finance.quotes_historical_yahoo(symbol, d1, d2, asobject=True)
              for symbol in symbols]
    open = np.array([q.open for q in quotes]).astype(np.float)
    close = np.array([q.close for q in quotes]).astype(np.float)
    variation = close - open
构建网络
现在,我们要根据股票价格变动之间的相关性来得到一个相关性矩阵,并且通过确定阈值来将这个矩阵变成一个邻接矩阵,以得到一个网络。
    # Learn a graphical structure from the correlations
    edge_model = covariance.GraphLassoCV()
    # standardize the time series: using correlations rather than covariance
    # is more efficient for structure recovery
    X = variation.copy().T
    X /= X.std(axis=0)
    edge_model.fit(X)
识别社区
我们使用Affinity Propagation的方法在这个网络上划分社区。使用AP的好处是它聚类时不用预先给出cluster的个数。
    _, labels = cluster.affinity_propagation(edge_model.covariance_)
    n_labels = labels.max()
    for i in range(n_labels + 1):
        print('Cluster %i: %s' % ((i + 1), ', '.join(names[labels == i])))
绘制网络
绘制网络包括一系列步骤:
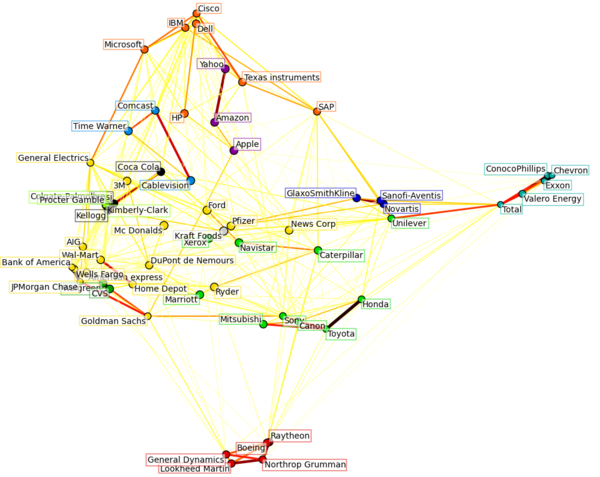
首先要给节点选定合适的位置。我们的思路是使用manifold.LocallyLinearEmbedding的方法将股票的协方差数据(1258维)降到二维,分别作为xy坐标绘制股票。
    _, labels = cluster.affinity_propagation(edge_model.covariance_)
    n_labels = labels.max()
    for i in range(n_labels + 1):
        print('Cluster %i: %s' % ((i + 1), ', '.join(names[labels == i])))
然后根据我们生产的节点坐标,绘制网络。在这个过程中,还要让同一个社区的节点颜色保持一致,并且要求节点的标签不与节点重合。
    # Find a low-dimension embedding for visualization: find the best position of
    # the nodes (the stocks) on a 2D plane

    # We use a dense eigen_solver to achieve reproducibility (arpack is
    # initiated with random vectors that we don't control). In addition, we
    # use a large number of neighbors to capture the large-scale structure.
    node_position_model = manifold.LocallyLinearEmbedding(
        n_components=2, eigen_solver='dense', n_neighbors=6)
    embedding = node_position_model.fit_transform(X.T).T

    # Visualization
    pl.figure(1, facecolor='w', figsize=(10, 8))
    pl.clf()
    ax = pl.axes([0., 0., 1., 1.])
    pl.axis('off')

    # Display a graph of the partial correlations
    partial_correlations = edge_model.precision_.copy()
    d = 1 / np.sqrt(np.diag(partial_correlations))
    partial_correlations *= d
    partial_correlations *= d[:, np.newaxis]
    non_zero = (np.abs(np.triu(partial_correlations, k=1)) > 0.02)

    # Plot the nodes using the coordinates of our embedding
    pl.scatter(embedding[0], embedding[1], s=100 * d ** 2, c=labels,
               cmap=pl.cm.spectral)

    # Plot the edges
    start_idx, end_idx = np.where(non_zero)
    #a sequence of (*line0*, *line1*, *line2*), where::
    #            linen = (x0, y0), (x1, y1), ... (xm, ym)
    segments = [[embedding[:, start], embedding[:, stop]]
                for start, stop in zip(start_idx, end_idx)]
    values = np.abs(partial_correlations[non_zero])
    lc = LineCollection(segments,
                        zorder=0, cmap=pl.cm.hot_r,
                        norm=pl.Normalize(0, .7 * values.max()))
    lc.set_array(values)
    lc.set_linewidths(15 * values)
    ax.add_collection(lc)

    # Add a label to each node. The challenge here is that we want to
    # position the labels to avoid overlap with other labels
    for index, (name, label, (x, y)) in enumerate(
            zip(names, labels, embedding.T)):
        dx = x - embedding[0]
        dx[index] = 1
        dy = y - embedding[1]
        dy[index] = 1
        this_dx = dx[np.argmin(np.abs(dy))]
        this_dy = dy[np.argmin(np.abs(dx))]
        if this_dx > 0:
            horizontalalignment = 'left'
            x = x + .002
        else:
            horizontalalignment = 'right'
            x = x - .002
        if this_dy > 0:
            verticalalignment = 'bottom'
            y = y + .002
        else:
            verticalalignment = 'top'
            y = y - .002
        pl.text(x, y, name, size=10,
                horizontalalignment=horizontalalignment,
                verticalalignment=verticalalignment,
                bbox=dict(facecolor='w',
                          edgecolor=pl.cm.spectral(label / float(n_labels)),
                          alpha=.6))

    pl.xlim(embedding[0].min() - .15 * embedding[0].ptp(),
            embedding[0].max() + .10 * embedding[0].ptp(),)
    pl.ylim(embedding[1].min() - .03 * embedding[1].ptp(),
            embedding[1].max() + .03 * embedding[1].ptp())

    #pl.show()
最后得到的图如下所示
