HMM隐性马可夫模型
原理
Hidden Markov model,隐性马可夫模型,是语音处理和图像识别等领域常常会用到的模型。它的核心原理是假设观测变量是由一些隐变量引起的,通过观测变量的数据去推断隐变量的发生概率。隐性马可夫和传统马可夫链的区别就是,在后者中,系统的状态是可观测的,我们只需要根据数据计算状态之间的转移概率即可。
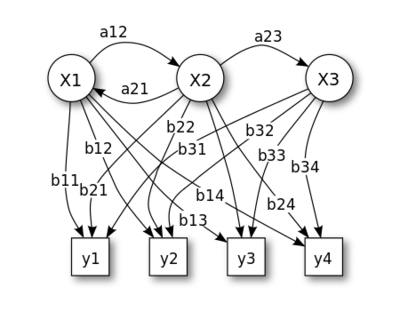
在上图中:
x 代表状态 (states)
y 代表观测到的行为 (possible observations)
a 代表状态转移概率 (state transition probabilities)
b 代表状态产生行为的概率 (output probabilities)
Alice和Bob的例子
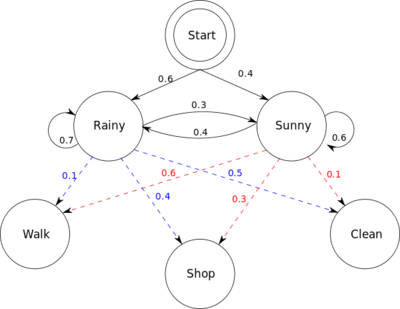
Alice和Bob是朋友,Bob每天打电话和Alice说今天做了什么事,Alice从中可以猜测Bob所在地方的天气如何(隐变量)。天气有两种状态,rainy和sunny。前者概率是0.6,后者概率是0.4,从一个状态转到另一个状态的概率如上图所示。Bob的行为有三种可能,散步(walking),购物(shopping)和在家里做家务(cleanning)。显然,下雨的时候比较可能在家做家务,天气晴朗的时候比较可能散步,但也不绝对。天气与行为之间的关系也如上图所示。
这个图里的信息使用python语言可以表达如下:
    from __future__ import division
    import numpy as np
    from sklearn import hmm

    states = ["Rainy", "Sunny"]
    n_states = len(states)

    observations = ["walk", "shop", "clean"]
    n_observations = len(observations)

    start_probability = np.array([0.6, 0.4])

    transition_probability = np.array([
      [0.7, 0.3],
      [0.4, 0.6]
    ])

    emission_probability = np.array([
      [0.1, 0.4, 0.5],
      [0.6, 0.3, 0.1]
    ])
使用sklearn自带的包来训练这个HMM模型是非常容易的:
    model = hmm.MultinomialHMM(n_components=n_states)
    model._set_startprob(start_probability)
    model._set_transmat(transition_probability)
    model._set_emissionprob(emission_probability)
训练模型完毕之后,我们就可以根据训练得到的模型,来从Bob对他自己行为的描述中推断天气了:
    bob_says = [0, 2, 1, 1, 2, 0]
    logprob, alice_hears = model.decode(bob_says, algorithm="viterbi")
    print "Bob says:", ", ".join(map(lambda x: observations[x], bob_says))
    print "Alice hears:", ", ".join(map(lambda x: states[x], alice_hears))
打印出来的结果是:
“Bob says: walk, clean, shop, shop, clean, walk” “Alice hears: Sunny, Rainy, Rainy, Rainy, Rainy, Sunny”
其实我们这里并不是使用实际数据来训练,而是直接指定了模型的参数。在真实的案例中,需要准备一个训练集,既有Bob行为的数据,也有当地天气的数据,从这里面,使用HMM,估计出各种参数。然后在测试样本中,再根据估计得到的参数和新的Bob行为数据来猜测真实的天气情况。
使用sklearn来制造一个toy model
先import一下包
    import numpy as np
    import matplotlib.pyplot as plt
    from sklearn import hmm
然后预设一些参数
    # Initial population probability
    start_prob = np.array([0.6, 0.3, 0.1, 0.0])
    # The transition matrix, note that there are no transitions possible
    # between component 1 and 4
    trans_mat = np.array([[0.7, 0.2, 0.0, 0.1],
                          [0.3, 0.5, 0.2, 0.0],
                          [0.0, 0.3, 0.5, 0.2],
                          [0.2, 0.0, 0.2, 0.6]])
    # The means of each component
    means = np.array([[0.0,  0.0],
                      [0.0, 11.0],
                      [9.0, 10.0],
                      [11.0, -1.0],
                      ])
    # The covariance of each component
    covars = .5 * np.tile(np.identity(2), (4, 1, 1))
使用预定的参数来指定模型
    # Build an HMM instance and set parameters
    model = hmm.GaussianHMM(4, "full", start_prob, trans_mat,
                            random_state=42)
    # Instead of fitting it from the data, we directly set the estimated
    # parameters, the means and covariance of the components
    model.means_ = means
    model.covars_ = covars
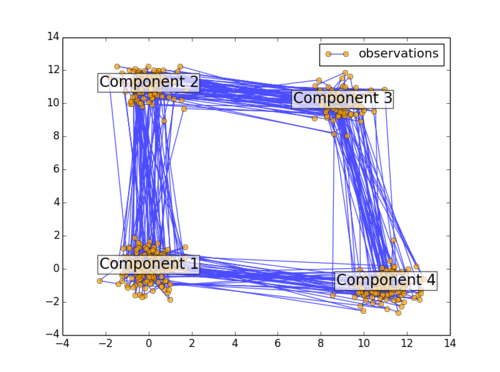
最后,把四个component画出来
    # Generate samples
    X, Z = model.sample(500)

    # Plot the sampled data
    plt.plot(X[:, 0], X[:, 1], "-o", label="observations", ms=6,
             mfc="orange", alpha=0.7)

    # Indicate the component numbers
    for i, m in enumerate(means):
        plt.text(m[0], m[1], 'Component %i' % (i + 1),
                 size=17, horizontalalignment='center',
                 bbox=dict(alpha=.7, facecolor='w'))
    plt.legend(loc='best')
如下图所示:


