图的绘制 Graph drawing
本词条由Ryan初步翻译 由CecileLi初步审校
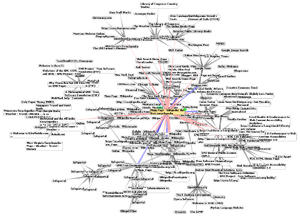
图的绘制 Graph drawing是数学和计算机科学的一个交叉领域,它结合了几何图形理论 geometric graph theory和信息可视化 information visualization的方法,可以用于对来自社会网络分析、制图学、语言学和生物信息学等各种应用场景进行二维描述。[1]
图形或网络图 network diagram的绘制是通过从图形抽象出的顶点和边表示的。这里说的图不应与图形本身混淆:毫不相似的图可以对应于同一个图形。[2]抽象地说,重要的是哪一对顶点是由边连在一起。然而,在具体的绘图中,这些顶点和边的排列影响了它的可理解性、可用性、制造成本和美学。[3]如果图形通过添加和删除边缘(动态绘制图形)而随时间变化,并且目的是保存用户的心理映射,那么问题会变得更糟糕。[4]
绘图惯例 Graphical conventions
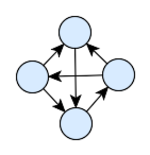
图经常绘制成节点链接图,其中顶点可以是为圆框、方框或文本标签,边表示为欧式平面 Euclidean Plane上的线段、折线或曲线。[3]节点链接图可以追溯到13世纪雷蒙·卢尔 Ramon Llull的作品,他为得到完全图,绘制了这种类型的图,以便分析形而上学概念集合之间的所有成对组合。[5]
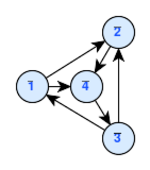
在有向图中,绘图惯例规定用箭头表示它们的方向;[2] 然而,用户研究表明,其他惯例(例如,渐缩)可以更有效地提供此信息。[6]向上的平面绘图绘图惯例是,每个边都从较低的顶点定向到较高的顶点,因此就不再需要箭头。[7]
节点链接图的替代约定包括:
质量度量 Quality measures
为了找到客观评价图形美观性和可用性的方法,我们定义了许多不同的图形质量度量方法。[9]除了用于指导对同一图形的不同布局方法之间的选择之外,某些布局方法还尝试直接优化度量方式。
- 图的交叉数 Crossing number是相交的成对的边的数目。如果图形是平面的,那么我们通常可以方便地画出没有任何边缘相交的图形;也就是说,在本例中,图形绘制表示图形嵌入 Graph embedding。然而,实际应用中经常出现非平面图,因此图形绘制算法通常必须考虑边缘交叉。[10]
- 一个图形的面积是它的最小边界盒 bounding box的大小,与任意两个顶点之间的最近距离有关。面积小的图通常比面积大的图更可取,因为它们可以让图画的特征以更大的尺寸显示,从而更醒目。当然,边框的纵横比也很重要。
- 对称显示的问题是在给定的图形中找到对称组 Symmetry Groups,并找到尽可能多地显示对称的绘图。一些布局方法自动形成对称图形;另外,一些绘图方法从查找输入图形中的对称性开始,并使用它们来构造绘图。[11]
- 重要的是,边缘的形状要尽可能简单,以便更容易循着它们的轨迹观察。在折线图中,一条边的复杂性可以通过它的弯曲数来衡量,多数方法的目的是提供很少的总弯曲或每条边很少弯曲的图。类似地,对于样条曲线,边的复杂性可以通过边上控制点的数量来度量。
- 几种常用的质量度量方法与边的长度有关:通常需要最小化边的总长度以及任何边的最大长度。此外,最好使边缘的长度一致而不是差别很大。
- 角度分辨率 Angular resolution是图形绘制中最小的锐角的度数。如果一个图的顶点高度高,那么它的角分辨率就很小,但是角分辨率也可以由角的函数来限定。[12]
- 图的斜率 slope number是在具有直线段边(允许交叉)的图中所需的明显边缘斜率的最小值。三次图 Cubic Graphs的斜率最大为4,五次图的斜率数可能是无界的,但四次的图的斜率是否有界仍然有待求证的。[12]
布局方法 Layout methods
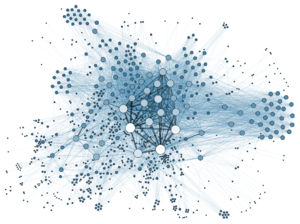
有许多不同的图形布局方法,如下
- 在''基于力的布局系统 Force-Based Layout中,图形绘制软件根据基于弹簧系统或分子力学的物理隐含的力系统,不断移动顶点来修改初始顶点的位置。通常,这些系统将相邻顶点之间的吸引力与所有对顶点之间的排斥力结合起来,以寻求一种边长较小而顶点分离良好的布局。这些系统可以执行梯度下降 gradient descent最小化的能量函数,或可以把力直接转化为节点的速度或加速度。[14]
- 正交布局法 Orthogonal layout methods,允许图形的边缘水平或垂直运行,平行于布局的坐标轴。这些方法最初是为超大规模集成电路和PCB布局问题而设计的,但它们也适用于图形绘制。它们通常涉及到一种多阶段的方法,通过用顶点替换交叉点来平面化输入图,找到一个平面化图的拓扑嵌入,选择边的方向来最小化弯曲,顶点的放置始终与这些方向一致,最后一个布局压缩阶段减少图形面积。[16]
- 树形布局算法显示了一种类似树的根状结构,适合树。通常,在一种称为气球布局的技术中,树形图每个节点的子节点被画在围绕该节点的圆上,这些圆的半径在树的较低层次上递减,因此这些圆不会重叠。[17]
- 分层图绘制方法 Layered graph drawing(通常称为杉山式图 Sugiyama-style drawing)最适合于有向无环图 directed acyclic graphs或接近无环的图,例如软件系统中模块或函数之间的依赖关系图。在这些方法中,图的节点使用Coffman Graham算法等方法被安排到水平层中,以这样的方式,大多数边从一层向下到下一层;在这一步之后,将每一层内的节点进行排列,使交叉最少。[18]
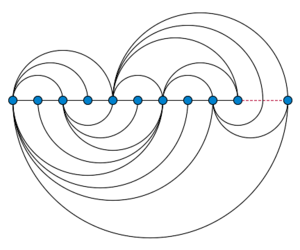
- 弧线图 Arc Diagram,这种布局风格可以追溯到20世纪60年代,将顶点放在一条直线上;边缘可以画成在直线上方或下方的半圆,也可以画成由多个半圆连接在一起的光滑曲线。
- 圆形布局法 Circular Layout将图形的顶点放置在一个圆上,仔细选择圆周上顶点的顺序,以减少交叉,并将相邻的顶点放置在彼此接近的位置。边可以画成圆的弦,也可以画成圆内外的弧线。在某些情况下,可以使用多个圆。[19]
- 优势图 Dominance drawing当且仅当一个顶点可以从另一个顶点到达时,画顶点的最优方式是:一个顶点向上,或向右,或两个顶点同时向上。这样,布局风格使得图的可达性关系在视觉上变得明显。[20]
专用图
在其他应用领域出现的图和图绘制包括:
- 社会图 Sociogram,社会网络图,通常由社会网络分析软件提供;[21]
- 哈塞图 Hasse diagram,一种专门用于部分顺序的图形绘制[22]
- 'Dessin d'enfants,代数几何中使用的一种图形画法;模板:Sfnp
- 状态图 State diagram,有限状态机的图形表示;模板:Sfnp
- 计算机网络图 Computer network diagram,描述计算机网络中的节点和连接;模板:Sfnp
- 流程图 Flowchart和drakon 图,其中节点表示算法的步骤,边表示步骤之间的控制流的绘图;
- 数据流程图 Data-Flow Diagram,其中节点表示信息系统的组件,边缘表示信息从一个组件到另一个组件的移动;
- 生物信息学包括系统发育树,蛋白质,蛋白质相互作用网络,和代谢途径。模板:Sfnp
此外,电子设计自动化 electronic design automation(EDA)的布局和布线步骤在很多方面与图形绘制相似,而在分布式计算 distributed computing中贪婪嵌入 Greedy embedding的问题也是如此,并且图形绘制文献包括从EDA文献中借来的一些结果。然而,这些问题也在几个重要方面有所不同:例如,在 EDA,面积最小化和信号长度比美观更重要,EDA中的路由问题可能每个网有两个以上的终端,而图绘制中的类似问题通常只涉及每条边的顶点对。
软件
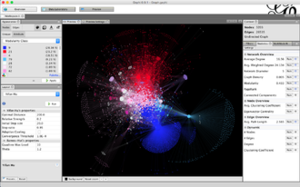
软件、系统和绘制图形系统的提供者包括:
- BioFabric:开源软件,用于将节点绘制为水平线来可视化大型网络。
- Cytoscape:可视化分子相互作用网络的开源软件
- Gephi:开源网络分析和可视化软件
- Graph-Tool:一个免费/免费的Python库,用于分析图形
- Graphviz:来自美国电话电报公司的开放源码绘图系统[23]
- Linkurious:图形数据库的商业网络分析和可视化软件
- Microsoft Automatic Graph Layout:用于图表布局的开放源码。net库(以前称为GLEE)
- NetworkX:用于研究图和网络的Python库
- Tom Sawyer Perspectives:是一款基于图形的软件,用于构建企业级图形和数据可视化和分析应用程序。它是一个软件开发工具包(SDK),具有基于图形的设计和预览环境
- Tulip (software),an open source data visualization tool
Tulip :[26] 开源数据可视化工具
- yEd 具有图形布局功能的图形编辑器[27]
- PGF/TikZ 带graphdrawing软件包的3.0(需要LuaTeX)[28]
- LaNet-vi:开源大型网络可视化软件
- Edraw Max:2D商业技术制图软件
参考文献
- ↑ Di Battista et al. (1994), pp. vii–viii; Herman, Melançon & Marshall (2000), Section 1.1, "Typical Application Areas".
- ↑ 2.0 2.1 Di Battista et al. (1994), p. 6.
- ↑ 3.0 3.1 Di Battista et al. (1994), p. viii.
- ↑ Misue et al. (1995)
- ↑ Knuth, Donald E. (2013), "Two thousand years of combinatorics", in Wilson, Robin; Watkins, John J. (eds.), Combinatorics: Ancient and Modern, Oxford University Press, pp. 7–37.
- ↑ Holten & van Wijk (2009); Holten et al. (2011).
- ↑ Garg & Tamassia (1995).
- ↑ Longabaugh (2012).
- ↑ Di Battista et al. (1994), Section 2.1.2, Aesthetics, pp. 14–16; Purchase, Cohen & James (1997).
- ↑ Di Battista et al. (1994), p 14.
- ↑ Di Battista et al. (1994), p. 16.
- ↑ 12.0 12.1 Pach & Sharir (2009).
- ↑ Grandjean, Martin (2014). "La connaissance est un réseau". Les Cahiers du Numérique. 10 (3): 37–54. doi:10.3166/lcn.10.3.37-54. Retrieved 2014-10-15.
- ↑ Di Battista et al. (1994), Section 2.7, "The Force-Directed Approach", pp. 29–30, and Chapter 10, "Force-Directed Methods", pp. 303–326.
- ↑ Beckman (1994); Koren (2005).
- ↑ Di Battista et al. (1994), Chapter 5, "Flow and Orthogonal Drawings", pp. 137–170; 模板:Harv.
- ↑ Herman, Melançon & Marshall (2000), Section 2.2, "Traditional Layout – An Overview".
- ↑ Sugiyama, Tagawa & Toda (1981); Bastert & Matuszewski (2001); Di Battista et al. (1994), Chapter 9, "Layered Drawings of Digraphs", pp. 265–302.
- ↑ Doğrusöz, Madden & Madden (1997).
- ↑ Di Battista et al. (1994), Section 4.7, "Dominance Drawings", pp. 112–127.
- ↑ Scott (2000); Brandes, Freeman & Wagner (2014).
- ↑ Di Battista et al. (1994), pp. 15–16, and Chapter 6, "Flow and Upward Planarity", pp. 171–214; Freese (2004);
- ↑ "Graphviz and Dynagraph – Static and Dynamic Graph Drawing Tools", by John Ellson, Emden R. Gansner, Eleftherios Koutsofios, Stephen C. North, and Gordon Woodhull, in Jünger & Mutzel (2004).
- ↑ GraphPlot Mathematica documentation
- ↑ Graph drawing tutorial
- ↑ "Tulip – A Huge Graph Visualization Framework", by David Auber, in Jünger & Mutzel (2004).
- ↑ "yFiles – Visualization and Automatic Layout of Graphs", by Roland Wiese, Markus Eiglsperger, and Michael Kaufmann, in Jünger & Mutzel (2004)
- ↑ Tantau (2013); see also the older GD 2012 presentation
一般参考资料
- Di Battista, Giuseppe; Eades, Peter; Tamassia, Roberto; Tollis, Ioannis G. (1994), "Algorithms for Drawing Graphs: an Annotated Bibliography", Computational Geometry: Theory and Applications, 4 (5): 235–282, doi:10.1016/0925-7721(94)00014-x.
- Di Battista, Giuseppe; Eades, Peter; Tamassia, Roberto; Tollis, Ioannis G. (1998), Graph Drawing: Algorithms for the Visualization of Graphs, Prentice Hall, ISBN 978-0-13-301615-4
{{citation}}: Cite has empty unknown parameters:|1=and|2=(help). - Herman, Ivan; Melançon, Guy; Marshall, M. Scott (2000), "Graph Visualization and Navigation in Information Visualization: A Survey", IEEE Transactions on Visualization and Computer Graphics, 6 (1): 24–43, doi:10.1109/2945.841119.
- Jünger, Michael; Mutzel, Petra (2004), Graph Drawing Software, Springer-Verlag, ISBN 978-3-540-00881-1.
citation|title=Drawing Graphs: Methods and Models|editor1-first=Michael|editor1-last=Kaufmann|editor2-first=Dorothea|editor2-last=Wagner|publisher=Springer-Verlag|series=Lecture Notes in Computer Science|volume=2025|year=2001|doi=10.1007/3-540-44969-8|isbn=978-3-540-42062-0}}. citation|editor-first=Roberto|editor-last=Tamassia|editor-link=Roberto Tamassia|title=Handbook of Graph Drawing and Visualization|publisher=CRC Press|url=http://cs.brown.edu/~rt/gdhandbook/%7Cyear=2014%7Caccess-date=2013-08-28%7Carchive-url=https://web.archive.org/web/20130815181243/http://cs.brown.edu/~rt/gdhandbook/%7Carchive-date=2013-08-15%7Curl-status=dead}}.
专门的子主题
- Anderson, James Andrew; Head, Thomas J. (2006), Automata Theory with Modern Applications, Cambridge University Press, pp. 38–41, ISBN 978-0-521-84887-9.
- Bachmaier, Christian; Brandes, Ulrik; Schreiber, Falk (2014), "Biological Networks", in Tamassia, Roberto (ed.), Handbook of Graph Drawing and Visualization, CRC Press, pp. 621–651.
- Bastert, Oliver; Matuszewski, Christian (2001), "Layered drawings of digraphs", in Kaufmann, Michael; Wagner, Dorothea (eds.), Drawing Graphs: Methods and Models, Lecture Notes in Computer Science, vol. 2025, Springer-Verlag, pp. 87–120, doi:10.1007/3-540-44969-8_5, ISBN 978-3-540-42062-0.
- Beckman, Brian (1994), Theory of Spectral Graph Layout, Tech. Report MSR-TR-94-04, Microsoft Research.
- Brandes, Ulrik; Freeman, Linton C.; Wagner, Dorothea (2014), "Social Networks", in Tamassia, Roberto (ed.), Handbook of Graph Drawing and Visualization, CRC Press, pp. 805–839.
- Di Battista, Giuseppe; Rimondini, Massimo (2014), "Computer Networks", in Tamassia, Roberto (ed.), Handbook of Graph Drawing and Visualization, CRC Press, pp. 763–803.
- Doğrusöz, Uğur; Madden, Brendan; Madden, Patrick (1997), "Circular layout in the Graph Layout toolkit", in North, Stephen (ed.), Symposium on Graph Drawing, GD '96 Berkeley, California, USA, September 18–20, 1996, Proceedings, Lecture Notes in Computer Science, vol. 1190, Springer-Verlag, pp. 92–100, doi:10.1007/3-540-62495-3_40, ISBN 978-3-540-62495-0.
- Eiglsperger, Markus; Fekete, Sándor; Klau, Gunnar (2001), "Orthogonal graph drawing", in Kaufmann, Michael; Wagner, Dorothea (eds.), Drawing Graphs, Lecture Notes in Computer Science, vol. 2025, Springer Berlin / Heidelberg, pp. 121–171, doi:10.1007/3-540-44969-8_6, ISBN 978-3-540-42062-0.
- Freese, Ralph (2004), "Automated lattice drawing", in Eklund, Peter (ed.), Concept Lattices: Second International Conference on Formal Concept Analysis, ICFCA 2004, Sydney, Australia, February 23-26, 2004, Proceedings (PDF), Lecture Notes in Computer Science, vol. 2961, Springer-Verlag, pp. 589–590, CiteSeerX 10.1.1.69.6245, doi:10.1007/978-3-540-24651-0_12, ISBN 978-3-540-21043-6.
- Garg, Ashim; Tamassia, Roberto (1995), "Upward planarity testing", Order, 12 (2): 109–133, CiteSeerX 10.1.1.10.2237, doi:10.1007/BF01108622, MR 1354797.
- Holten, Danny; Isenberg, Petra; van Wijk, Jarke J.; Fekete, Jean-Daniel (2011), "An extended evaluation of the readability of tapered, animated, and textured directed-edge representations in node-link graphs", IEEE Pacific Visualization Symposium (PacificVis 2011) (PDF), pp. 195–202, doi:10.1109/PACIFICVIS.2011.5742390, ISBN 978-1-61284-935-5.
- Holten, Danny; van Wijk, Jarke J. (2009), "A user study on visualizing directed edges in graphs", Proceedings of the 27th International Conference on Human Factors in Computing Systems (CHI '09) (PDF), pp. 2299–2308, CiteSeerX 10.1.1.212.5461, doi:10.1145/1518701.1519054, ISBN 9781605582467, archived from the original (PDF) on 2011-11-06.
- Koren, Yehuda (2005), "Drawing graphs by eigenvectors: theory and practice" (PDF), Computers & Mathematics with Applications, 49 (11–12): 1867–1888, doi:10.1016/j.camwa.2004.08.015, MR 2154691, archived from the original (PDF) on 2012-04-02, retrieved 2011-09-17.
- Longabaugh, William (2012), "Combing the hairball with BioFabric: a new approach for visualization of large networks" (PDF), BMC Bioinformatics, 13: 275, doi:10.1186/1471-2105-13-275, PMC 3574047, PMID 23102059.
- Madden, Brendan; Madden, Patrick; Powers, Steve; Himsolt, Michael (1996), "Portable graph layout and editing", in Brandenburg, Franz J. (ed.), Graph Drawing: Symposium on Graph Drawing, GD '95, Passau, Germany, September 20–22, 1995, Proceedings, Lecture Notes in Computer Science, vol. 1027, Springer-Verlag, pp. 385–395, doi:10.1007/BFb0021822, ISBN 978-3-540-60723-6.
- Misue, K.; Eades, P.; Lai, W.; Sugiyama, K. (1995), "Layout Adjustment and the Mental Map", Journal of Visual Languages and Computing, 6 (2): 183–210, doi:10.1006/jvlc.1995.1010.
- Nachmanson, Lev; Robertson, George; Lee, Bongshin (2008), "Drawing Graphs with GLEE" (PDF), in Hong, Seok-Hee; Nishizeki, Takao; Quan, Wu (eds.), Graph Drawing, 15th International Symposium, GD 2007, Sydney, Australia, September 24–26, 2007, Revised Papers, Lecture Notes in Computer Science, vol. 4875, Springer-Verlag, pp. 389–394, doi:10.1007/978-3-540-77537-9_38, ISBN 978-3-540-77536-2
{{citation}}: Cite has empty unknown parameter:|1=(help). - Pach, János; Sharir, Micha (2009), "5.5 Angular resolution and slopes", Combinatorial Geometry and Its Algorithmic Applications: The Alcalá Lectures, Mathematical Surveys and Monographs, vol. 152, American Mathematical Society, pp. 126–127.
- Purchase, H. C.; Cohen, R. F.; James, M. I. (1997), "An experimental study of the basis for graph drawing algorithms" (PDF), Journal of Experimental Algorithmics, 2, Article 4, doi:10.1145/264216.264222https://en.wikipedia.org/wiki/Defekte_Weblinks?dwl={{{url}}} Seite nicht mehr abrufbar], Suche in Webarchiven: Kategorie:Wikipedia:Weblink offline (andere Namensräume)[http://timetravel.mementoweb.org/list/2010/Kategorie:Wikipedia:Vorlagenfehler/Vorlage:Toter Link/URL_fehlt .
- Saaty, Thomas L. (1964), "The minimum number of intersections in complete graphs", Proc. Natl. Acad. Sci. U.S.A., 52 (3): 688–690, doi:10.1073/pnas.52.3.688, PMC 300329, PMID 16591215.
- Scott, John (2000), "Sociograms and Graph Theory", Social network analysis: a handbook (2nd ed.), Sage, pp. 64–69, ISBN 978-0-7619-6339-4.
- Sugiyama, Kozo; Tagawa, Shôjirô; Toda, Mitsuhiko (1981), "Methods for visual understanding of hierarchical system structures", IEEE Transactions on Systems, Man, and Cybernetics, SMC-11 (2): 109–125, doi:10.1109/TSMC.1981.4308636, MR 0611436.
- Tantau, Till (2013), "Graph Drawing in TikZ", Journal of Graph Algorithms and Applications, 17 (4): 495–513, doi:10.7155/jgaa.00301.
- Zapponi, Leonardo (August 2003), "What is a Dessin d'Enfant" (PDF), Notices of the American Mathematical Society, 50: 788–789.
其他链接
- GraphX library for .NET: open-source WPF library for graph calculation and visualization. Supports many layout and edge routing algorithms.
- Graph drawing e-print archive: including information on papers from all Graph Drawing symposia.
- 模板:Dmoz for many additional links related to graph drawing.
本中文词条Ryan翻译,由CecileLi审校,薄荷编辑欢迎在讨论页面留言。
本词条内容翻译自 wikipedia.org,遵守 CC3.0协议。
