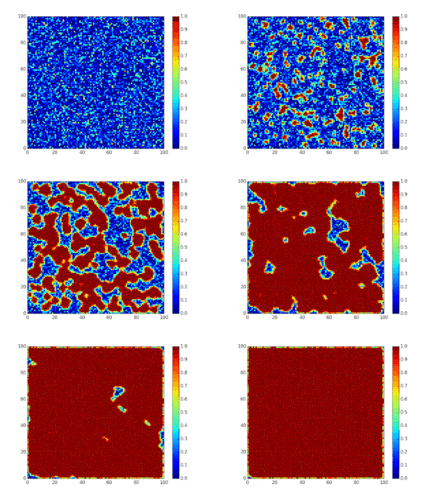
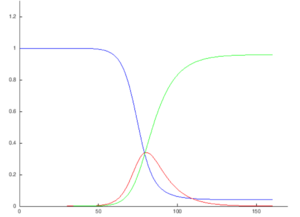
仓室模型
仓室模型Compartmental models简化了传染病传播的数学模型。人群被划分为带有标签的类别,例如,S,I,和 R,(易感者,染病者和康复者)。不同类别人群的标签会发生变化。标签的变化反映了不同类别人群之间的转化模式,例如SEIS模型代表易感者类型可以转变为暴露者类型、暴露者类型可以转变为染病者类型,染病者类型可以再次转变回易感者类型。
这类模型起源于20世纪初,克马克和麦克德里克在1927年的一项重要工作。[1]
这些模型通常使用确定参数的常微分方程进行分析,但也可以使用具有随机参数的随机框架进行分析,这种随机框架更加贴近现实,但分析起来要复杂得多。
模型试图预测疾病的传播方式、感染总人数、流行病持续时间等,并估计各种流行病学参数,如再生数。这些模型可以显示不同的公共卫生干预措施如何对疾病传播产生影响,例如,控制疾病传播最有效的方式是在指定人群中发放数量有限的疫苗。
SIR模型
SIR 模型[2][3] 是最简单的仓室模型之一,许多模型都是这种基本模型的衍生物。该模型由三种类型的人群组成:
S:易感者。当一个易感者和一个感病者产生“传染性接触”时,易感者就会感染这种疾病,并被归入染病者类别。
I:染病者。这类人群已经感染疾病,并且有能力感染易感者。
R:康复者或病死者。这些人已经被感染过,并且已经从疾病中康复并被归入康复者类别,或者已经因感染疾病死亡。假如死亡数量与总人口数量相比可以忽略不计,这种类别人群也可称为“康复者”或“抵抗者”。
这个模型可以合理地预测[4]传染病在人与人之间传播的情况,以及康复后会产生持续性抗体的疾病,如麻疹、腮腺炎和风疹等疾病。
这些变量(S、I和R)表示特定时间每个类别人群的数量。为了表示易感者、染病者和康复者数量会随时间变化(总的人群规模保持不变) ,我们将这些类别人群的精确数量设为时间t的函数: S(t)、 I(t)和 R(t)。对于特定人群中的特定疾病,这些函数可以用于预测潜在的传染病暴发和控制传染病的大规模爆发。
从变量t可以看出,该模型是动态的,每种类别人群的数量可以随时间波动。这种动态的重要性在传染期较短的地方性疾病中表现得最为明显,如在1968年引进疫苗之前英国的麻疹。由于易感者数量[math]\displaystyle{ (S (t)) }[/math]随着时间发生变化,这类疾病往往会周期性爆发。在流行病爆发期间,由于更多的人受到感染,转变为染病者和康复者的类别,易感者数量迅速下降。这种疾病只有易感者数量增加时才能再次爆发,例如:由于后代的出生,增加易感者人群数量。
人群中的每个成员通常由易感者转变为感染者,然后转化为康复者。这可以显示为一个流程图,在这个流程图中,方框代表不同的类别,箭头代表类别之间的过渡,即:
传染率
为了完整说明这个模型,箭头上标明了类别之间的传染率。在S和I之间,传染率假定为[math]\displaystyle{ d\left( S/N \right) /dt=-\beta SI/N^2 }[/math],其中 [math]\displaystyle{ N }[/math] 是总人口,[math]\displaystyle{ β }[/math]是平均每人每次接触的数量乘以易感者和感病者之间接触传播疾病的概率,[math]\displaystyle{ SI/N^2 }[/math] 是易感个体和染病个体之间接触的比例,这种接触导致易感个体转化为染病个体。(这在数学上与化学中的质量作用定律the law of mass action类似,在这个定律中,分子之间的随机碰撞导致化学反应,反应比例与两种反应物的浓度成正比)。
在 I 和 R 之间,假设转化率与染病者的数目成正比,即[math]\displaystyle{ γI }[/math]。这相当于假设一个染病者在任何时间间隔[math]\displaystyle{ dt }[/math]内恢复的概率简化为[math]\displaystyle{ γdt }[/math]。如果平均每个人在时间段[math]\displaystyle{ D }[/math]内具有传染性,那么[math]\displaystyle{ γ= 1/D }[/math]。这也相当于假设一个人在感染状态下的持续时间长度是一个服从指数分布的随机变量。“经典的” SIR 模型可以通过更加复杂和贴近现实的分布来修正I-R 传染率(例如爱尔郎分布Erlang distribution[5])。
对于没有染病者康复的特殊情况([math]\displaystyle{ γ=0 }[/math]) ,SIR 模型就简化为一个非常简单的 SI 模型,该模型具有一个逻辑解,即其中每个个体最终都会被感染。
缺少生命动力学的SIR模型
流行病导致的动态变化,例如流感,往往比出生和死亡的导致的动态变化更快,因此,出生和死亡往往被简单的仓室模型comparenmental models所忽略。没有上述所谓的生命动力学(出生和死亡,有时称为人口统计学)的 SIR 系统可以用下列一组常微分方程表示:[6]
- [math]\displaystyle{ \begin{align} & \frac{dS}{dt} = - \frac{\beta I S}{N}, \\[6pt] & \frac{dI}{dt} = \frac{\beta I S}{N}- \gamma I, \\[6pt] & \frac{dR}{dt} = \gamma I, \end{align} }[/math]
其中,[math]\displaystyle{ S }[/math] 是易感人群的数量,[math]\displaystyle{ I }[/math] 是染病人群的数量,[math]\displaystyle{ R }[/math] 是康复人群的数量(死亡或康复) ,[math]\displaystyle{ N }[/math] 是这三者的总和。
这个模型是William Ogilvy Kermack和Anderson Gray McKendrick首次提出的,我们这里的模型是Kermark - McKendrick理论的一个特例,它是在McKendrick与Ronald Ross合作的基础上提出的。
这个系统是非线性的,但是可以推导出隐式的解析解analytic solution。首先:
- [math]\displaystyle{ \frac{dS}{dt} + \frac{dI}{dt} + \frac{dR}{dt} = 0, }[/math]
it follows that:
it follows that:
接下来是:
- [math]\displaystyle{ S(t) + I(t) + R(t) = \text{constant} = N, }[/math]
用数学形式来体现人口 [math]\displaystyle{ N }[/math]的稳定性。注意,上述关系意味着只需要在方程中研究三个变量中的两个。
其次,我们注意到不同种类人群的动态取决于以下比例:
- [math]\displaystyle{ R_0 = \frac{\beta}{\gamma}, }[/math]
所谓的基本再生数basic reprodution numer(亦称基本再生率)。该比率是在所有受试者都是易感类别的人群中,由一次感染引起的新感染的预期数量(这些新感染有时称为二次感染)得出的。如果我们说两次感染之间的典型时间是 [math]\displaystyle{ T_{c}=\beta^{-1} }[/math],而康复之前的典型时间是 [math]\displaystyle{ T_{r}=\gamma^{-1} }[/math] ,[7][8] 那么这个想法可能更容易被理解。由此可以得出,平均而言,在感染者康复之前,感染者与其他人的接触次数为: [math]\displaystyle{ T_{r}/T_{c}. }[/math]
通过将第一个微分方程differential equation除以第三个微分方程,分离变量并进行积分,我们得到
- [math]\displaystyle{ S(t) = S(0) e^{-R_0(R(t) - R(0))/N}, }[/math]
其中,[math]\displaystyle{ S(0) }[/math]和[math]\displaystyle{ R(0) }[/math]分别是易感者和康复者的初始人数。
易感人群的初始比例[math]\displaystyle{ S_0=S(0)/N }[/math],以及
在[math]\displaystyle{ t \to \infty, }[/math]的极限条件下,易感个体和染病个体的比例分别为[math]\displaystyle{ s_\infty = S(\infty) / N }[/math] 和 [math]\displaystyle{ r_\infty = R(\infty) / N }[/math]。此时有
- [math]\displaystyle{ s_\infty = 1 - r_\infty = s_0 e^{-R_0(r_\infty - r_0)} }[/math]
(请注意,在这个极限时,没有染病者)。
这个超越方程有一个Lambert函数解,[9]即
- [math]\displaystyle{ s_\infty = 1-r_\infty = - R_0^{-1}\, W(-s_0 R_0 e^{-R_0(1-r_0)}). }[/math]
这表明,在流行病结束时,除非[math]\displaystyle{ s_0=0 }[/math],否则一定有个体没有转化为康复状态,一些人仍然是易感类别。这意味着,传染病的结束是由于染病者的减少,而不是完全由于没有易感者。
基本再生数basic reprodution numer和最初的易感人群比例的作用都极其重要。事实上,将易感者人群数量变化的等式可以重写成如下形式:
- [math]\displaystyle{ \frac{dI}{dt} = \left(R_0 \frac{S}{N} - 1\right) \gamma I, }[/math]
如果:
- [math]\displaystyle{ R_{0} \cdot S(0) \gt N, }[/math]
那么:
- [math]\displaystyle{ \frac{dI}{dt}(0) \gt 0 , }[/math]
也就是说,随着染病者数量的增加(达到人口相当大的一个比例) ,将会有一场流行病的爆发。相反,如果
- [math]\displaystyle{ R_{0} \cdot S(0) \lt N, }[/math]
那么
- [math]\displaystyle{ \frac{dI}{dt}(0) \lt 0 , }[/math]
也就是说,这种情况与易感者的初始规模无关,这时疾病将不会引起流行病的爆发。因此,很明显,基本再生数basic reprodution numer和最初的易感者人群数量都极其重要。
感染力
注意,在上面的模型中,函数:
- [math]\displaystyle{ F = \beta I, }[/math]
建立了从易感者到染病者的传染率模型,这被称为感染力the force of infection。然而,对于大部分传染病来说,更现实的做法是考虑一种感染力the force of infection,这种传染力并不取决于染病者人群的绝对数量,而是取决于染病者人群的比例(就总人口[math]\displaystyle{ N }[/math]而言) :
- [math]\displaystyle{ F = \beta \frac{I}{N} . }[/math]
Capasso[10]和后来的其他作者提出了非线性的感染力,以建模更现实的传染过程。
SIR 模型的精确解析解
2014年,Harko 和合作者推导出了 SIR 模型的精确解析解analytical solution。在没有考虑正常出生和死亡生命动力学的情况下,对于 [math]\displaystyle{ \mathcal{S}(u) =S(t) }[/math] 等,它对应以下时间参数化
- [math]\displaystyle{ \mathcal{R}(u)=R(0) -\rho \ln(u) }[/math]
为了
- [math]\displaystyle{ t= \frac{N}{\beta}\int_u^1 \frac{du^*}{u^*\mathcal{I}(u^*)} , \quad \rho=\frac{\gamma N}{\beta}, }[/math]
有初始条件
- [math]\displaystyle{ (\mathcal{S}(1),\mathcal{I}(1),\mathcal{R}(1))=(S(0),N -R(0)-S(0),R(0)), \quad u_T\lt u\lt 1, }[/math]
其中[math]\displaystyle{ u_T }[/math]满足[math]\displaystyle{ \mathcal{I}(u_T)=0 }[/math]。根据上面的超越方程transcendental equation [math]\displaystyle{ R_{\infty} }[/math] ,如果[math]\displaystyle{ S(0) \neq 0) }[/math] and [math]\displaystyle{ I_{\infty}=0 }[/math],那么[math]\displaystyle{ u_T=e^{-(R_{\infty}-R(0))/\rho}(=S_{\infty}/S(0) }[/math]。
等价的解析解analytical solution由米勒[11][12]发现
- [math]\displaystyle{ \begin{align} S(t) & = S(0) e^{-\xi(t)} \\[8pt] I(t) & = N-S(t)-R(t) \\[8pt] R(t) & = R(0) + \rho \xi(t) \\[8pt] \xi(t) & = \frac{\beta}{N}\int_0^t I(t^*) \, dt^* \end{align} }[/math]
在这里,[math]\displaystyle{ \xi(t) }[/math]可以解释为随着时间[math]\displaystyle{ t }[/math]变化,一个人预期接触到的染病者数量。这两个解是通过[math]\displaystyle{ e^{-\xi(t)} = u }[/math]相关联的。
实际上,同样的结果可以在Kermack 和 McKendrick的原著中找到。
注意到原微分方程右边的所有项都与[math]\displaystyle{ I }[/math]成正比,这些解就很容易理解了。这样,方程组就可以通过[math]\displaystyle{ I }[/math]来分解,通过时间重缩放,使得左边的微分算子变成[math]\displaystyle{ d/d\tau }[/math],其中[math]\displaystyle{ d\tau=I dt }[/math],即 [math]\displaystyle{ \tau=\int I dt }[/math]。这些微分方程现在都是线性的,而第三个方程,即形式为[math]\displaystyle{ dR/d\tau = }[/math] 的常量,表明 [math]\displaystyle{ \tau }[/math]和[math]\displaystyle{ R }[/math](和[math]\displaystyle{ \xi }[/math])仅仅是线性关系。
具有生命动力学和稳定人口的SIR模型
考虑有死亡率[math]\displaystyle{ \mu }[/math]和出生率[math]\displaystyle{ \Lambda }[/math]的人群,以及正在传播的传染病。具有质量作用传递的模型是:
- [math]\displaystyle{ \begin{align} \frac{dS}{dt} & = \Lambda - \mu S - \frac{\beta I S}{N} \\[8pt] \frac{dI}{dt} & = \frac{\beta I S}{N} - \gamma I -\mu I \\[8pt] \frac{dR}{dt} & = \gamma I - \mu R \end{align} }[/math]
其无病平衡点the disease-free quilibrium为:
- [math]\displaystyle{ \left(S(t),I(t),R(t)\right) =\left(\frac{\Lambda}{\mu},0,0\right). }[/math]
在这种情况下,我们可以得出一个基本再生数:
- [math]\displaystyle{ R_0 = \frac{ \beta\Lambda }{\mu(\mu+\gamma)}, }[/math]
这种基本再生数具有临界性质。事实上,独立于具有生物学意义的初始值,我们可以证明:
- [math]\displaystyle{ R_0 \gt 1 , I(0)\gt 0 \Rightarrow \lim_{t \to \infty} (S(t),I(t),R(t)) = \textrm{EE} = \left(\frac{\gamma+\mu}{\beta},\frac{\mu}{\beta}\left(R_0-1\right), \frac{\gamma}{\beta} \left(R_0-1\right)\right). }[/math]
EE点被称为地方病平衡点(这种疾病还没有完全根除,仍然存在于人群中)。通过启发式的论证,表明[math]\displaystyle{ R_{0} }[/math]可以理解为在完全易感人群中,由一个染病者引起的平均感染人数,上述关系在生物学上意味着,如果这个数字小于或等于1,这种疾病就会灭绝,而如果这个数字大于1,这种疾病就会在人群中永久地流行下去。
基础SIR模型的变化
SIS模型
有些传染病,例如普通感冒和流感,并不能产生持久的免疫力。这种传染病在感染康复后不会产生免疫力,个体会再次变为易感染类型。
SIS compartmental model
[图5:SIS compartmental modelSIS传染病模型]
我们有以下模型:
- [math]\displaystyle{ \begin{align} \frac{dS}{dt} & = - \frac{\beta S I}{N} + \gamma I \\[6pt] \frac{dI}{dt} & = \frac{\beta S I}{N} - \gamma I \end{align} }[/math]
注意,用N表示人群总数:
- [math]\displaystyle{ \frac{dS}{dt} + \frac{dI}{dt} = 0 \Rightarrow S(t)+I(t) = N }[/math].
由此可见:
- [math]\displaystyle{ \frac{dI}{dt} = (\beta - \gamma) I - \frac{\beta}{N} I^2 }[/math],
也就是。传染病的动态性是由Logistic函数控制的,所以对于所有的[math]\displaystyle{ \forall I(0) \gt 0 }[/math]:
- [math]\displaystyle{ \begin{align} & \frac{\beta}{\gamma} \le 1 \Rightarrow \lim_{t \to +\infty}I(t)=0, \\[6pt] & \frac{\beta}{\gamma} \gt 1 \Rightarrow \lim_{t \to +\infty}I(t) = \left(1 - \frac{\gamma}{\beta} \right) N. \end{align} }[/math]
这个模型可以找到一个解析解analytical solution(通过对变量进行变换:[math]\displaystyle{ I = y^{-1} }[/math] 并将其代入平均场方程the mean-field euations) ,[13] 使基本再生率大于单位数。给出了解如下:
- [math]\displaystyle{ I(t) = \frac{I_\infty}{1+V e^{-\chi t}} }[/math].
其中 [math]\displaystyle{ I_\infty = (1 -\gamma/\beta)N }[/math]是地方性传染病人群数量,[math]\displaystyle{ \chi = \beta-\gamma }[/math], [math]\displaystyle{ V = I_\infty/I_0 - 1 }[/math]。假设系统是封闭的,那么易感者人群数量是[math]\displaystyle{ S(t) = N - I(t) }[/math]。
作为一种特殊情况,通过假设[math]\displaystyle{ R=0 }[/math]得到通常的 Logistic函数。这也可以在 SIR 模型中考虑,该模型有[math]\displaystyle{ R=0 }[/math],即没有康复者。这就是SI模型。微分方程系统使用[math]\displaystyle{ S=N-I }[/math],因此可以简化为:
- [math]\displaystyle{ \frac{dI}{dt} \propto I\cdot (N-I). }[/math]
从长远来看,在这种模式下,所有的个体都会被感染。
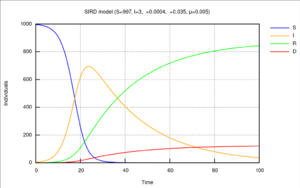
SIRD模型
Diagram of the SIRD model with initial values [math]\displaystyle{ S(0)=997, I(0)=3, R(0)=0 }[/math] and the rates for infection [math]\displaystyle{ \beta=0.4 }[/math], recovery [math]\displaystyle{ \gamma=0.035 }[/math] and mortality [math]\displaystyle{ \mu=0.005 }[/math]
[图6:Diagram of the SIRD model with initial values [math]\displaystyle{ S(0)=997, I(0)=3, R(0)=0 }[/math] and the rates for infection [math]\displaystyle{ \beta=0.4 }[/math], recovery [math]\displaystyle{ \gamma=0.035 }[/math] and mortality [math]\displaystyle{ \mu=0.005 }[/math]SIRD模型示意图,初始值[math]\displaystyle{ S(0)=997,I(0)=3, R(0)=0 }[/math],感染率[math]\displaystyle{ \beta=0.4 }[/math],康复率[math]\displaystyle{ \gamma=0.035 }[/math],死亡率 [math]\displaystyle{ \mu=0.005 }[/math]]

[图7:Animation of the SIRD model with initial values [math]\displaystyle{ S(0)=997, I(0)=3, R(0)=0 }[/math], initial rate for infection [math]\displaystyle{ \beta=0.5 }[/math] and constant rates for recovery [math]\displaystyle{ \gamma=0.035 }[/math] and mortality [math]\displaystyle{ \mu=0.005 }[/math]. If there is neither medicine nor vaccination available, it is only possible to reduce the infection rate (often referred to as „flattening the curve“) by appropriate measures (e. g. „social distancing“). This animation shows the impact of reducing the infection rate by 76 % (from [math]\displaystyle{ \beta=0.5 }[/math] down to [math]\displaystyle{ \beta=0.12 }[/math])SIRD模型动画,初始值[math]\displaystyle{ S(0)=997I(0)=3, R(0)=0 }[/math],初始感染率 [math]\displaystyle{ \beta=0.5 }[/math]和恒定康复率 [math]\displaystyle{ \gamma=0.035 }[/math] 和死亡率[math]\displaystyle{ \mu=0.005 }[/math]。如果既没有药物也没有疫苗可用,只有通过适当的措施(例如“社会距离”)才有可能降低感染率(通常称为“平缓曲线”)。这个动画展示了降低感染率76% 的效果(从 [math]\displaystyle{ \beta=0.5 }[/math]下降到[math]\displaystyle{ \beta=0.12 }[/math])。]
The Susceptible-Infectious-Recovered-Deceased-Model differentiates between Recovered (meaning specifically individuals having survived the disease and now immune) and Deceased.模板:Cn This model uses the following system of differential equations:
易感-染病-康复-死亡-模型区分了康复者(特别是指从疾病中存活下来并且现已免疫的个体)和死亡者。该模型使用了下列微分方程组:
- [math]\displaystyle{ \begin{align} & \frac{dS}{dt} = - \frac{\beta I S}{N}, \\[6pt] & \frac{dI}{dt} = \frac{\beta I S}{N} - \gamma I - \mu I, \\[6pt] & \frac{dR}{dt} = \gamma I, \\[6pt] & \frac{dD}{dt} = \mu I, \end{align} }[/math]
这里[math]\displaystyle{ \beta, \gamma, \mu }[/math]分别是感染率,康复率和死亡率。[14]
MSIR模型
对于包括麻疹在内的许多传染病,婴儿出生时并不易感染,由于母体抗体的保护(通过胎盘和初乳传播) ,婴儿在出生后的头几个月对该疾病免疫。这叫做被动免疫。这个额外的细节可以通过在模型的开始加入一个M类型(用于母系免疫)来显示。
To indicate this mathematically, an additional compartment is added, M(t). This results in the following differential equations:
MSIR compartmental modelTo indicate this mathematically, an additional compartment is added, M(t). This results in the following differential equations:
[图8:MSIR compartmental model. To indicate this mathematically, an additional compartment is added, M(t). This results in the following differential equations:MSIR 仓室模型为了从数学上表示这一点,增加了一个额外的分类,M(t)。这导致了下列微分方程:]
- [math]\displaystyle{ \begin{align} \frac{dM}{dT} & = \Lambda - \delta M - \mu M\\[8pt] \frac{dS}{dT} & = \delta M - \frac{\beta SI}{N} - \mu S\\[8pt] \frac{dI}{dT} & = \frac{\beta SI}{N} - \gamma I - \mu I\\[8pt] \frac{dR}{dT} & = \gamma I - \mu R \end{align} }[/math]
病原携带状态
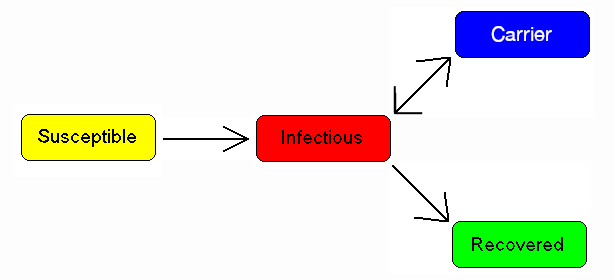
一些患有肺结核等传染病的人永远不会完全康复,而是继续携带这种传染病,同时他们自己也不会患上这种疾病。他们可能回归到染病者状态并出现症状(如肺结核),或者他们可能继续以携带者的状态传染给其他人,而不出现症状。最著名的例子可能是Mary Mallon,她将伤寒传染给了22个人。携带者被标记为C。
A simple modification of previous image by Viki Male to make the word "Carrier" plainly visible.
[图9:A simple modification of previous image by Viki Male to make the word "Carrier" plainly visible.对维基马累之前形象的一个简单修改,使单词“携带者”清晰可见。]
SEIR模型
对于许多传染病,有一段很长的疾病潜伏期,在此期间个人已经被感染,但他们自己还没有感病。在此期间,这个人是属于类别E(暴露者类型)。
SEIR compartmental model
[图10:SEIR compartmental modelSEIR传染病模型]
假设疾病潜伏期是一个随机变量,这个随机变量服从一个带有参数[math]\displaystyle{ ''a'' }[/math]的指数分布。(疾病平均潜伏期是[math]\displaystyle{ a^{-1} }[/math]),并且假设存在出生率[math]\displaystyle{ \Lambda }[/math]等于死亡率[math]\displaystyle{ \mu }[/math]的生命动力学,我们有这样的模型:
- [math]\displaystyle{ \begin{align} \frac{dS}{dt} & = \Lambda - \mu S - \frac{\beta I S}{N} \\[8pt] \frac{dE}{dt} & = \frac{\beta I S}{N} - (\mu +a ) E \\[8pt] \frac{dI}{dt} & = a E - (\gamma +\mu ) I \\[8pt] \frac{dR}{dt} & = \gamma I - \mu R. \end{align} }[/math]
我们有[math]\displaystyle{ S+E+I+R=N, }[/math],但是这是常量,因为(退化的)假设出生率和死亡率是相等的; 一般来说[math]\displaystyle{ N }[/math]是一个变量。
对于这种模式,基本再生数basic reproduction number是:
- [math]\displaystyle{ R_0 = \frac{a}{\mu+a}\frac{\beta}{\mu+\gamma}. }[/math]
类似于 SIR 模型,在这种情况下,我们有一个无病平衡(N,0,0,0)和一个地方病平衡 EE,可以证明,这独立于生物学意义上的初始条件
- [math]\displaystyle{ \left(S(0),E(0),I(0),R(0)\right) \in \left\{(S,E,I,R)\in [0,N]^4 : S \ge 0, E \ge 0, I\ge 0, R\ge 0, S+E+I+R = N \right\} }[/math]
它认为:
- [math]\displaystyle{ R_0 \le 1 \Rightarrow \lim_{t \to +\infty} \left(S(t),E(t),I(t),R(t)\right) = DFE = (N,0,0,0), }[/math]
- [math]\displaystyle{ R_0 \gt 1 , I(0)\gt 0 \Rightarrow \lim_{t \to +\infty} \left(S(t),E(t),I(t),R(t)\right) = EE. }[/math]
当接触率 < math > beta (t) </math >周期性变化时, DFE 全局吸引性的条件是,以下线性系统具有周期系数:
- [math]\displaystyle{ \begin{align} \frac{dE_1}{dt} & = \beta(t) I_1 - (\gamma +a ) E_1 \\[8pt] \frac{dI_1}{dt} & = a E_1 - (\gamma +\mu ) I_1 \end{align} }[/math]
是稳定的(它在复平面的单位圆内有它的 Floquet 特征值)。
SEIS模型
SEIS 模型类似于之前的 SEIR 模型,只是最终不会转化为免疫属性。
- [math]\displaystyle{ {\color{blue}{\mathcal{S} \to \mathcal{E} \to \mathcal{I} \to \mathcal{S}}} }[/math]
在这个模型中,感染不会留下任何免疫性,因此染病个体恢复到易感状态,移回 s (t)状态。下列微分方程描述了这一模型:
- [math]\displaystyle{ \begin{align} \frac{dS}{dT} & = \Lambda - \frac{\beta SI}{N} - \mu S + \gamma I \\[6pt] \frac{dE}{dT} & = \frac{\beta SI}{N} - (\epsilon + \mu)E \\[6pt] \frac{dI}{dT} & = \varepsilon E - (\gamma + \mu)I \end{align} }[/math]
MSEIR模型
考虑被动免疫和潜伏期的因素情况下的传染病,建立了 MSEIR 模型。
- [math]\displaystyle{ \color{blue}{\mathcal{M} \to \mathcal{S} \to \mathcal{E} \to \mathcal{I} \to \mathcal{R}} }[/math]
- [math]\displaystyle{ \begin{align} \frac{dM}{dT} & = \Lambda - \delta M - \mu M \\[6pt] \frac{dS}{dT} & = \delta M - \frac{\beta SI}{N} - \mu S \\[6pt] \frac{dE}{dT} & = \frac{\beta SI}{N} - (\varepsilon + \mu)E \\[6pt] \frac{dI}{dT} & = \varepsilon E - (\gamma + \mu)I \\[6pt] \frac{dR}{dT} & = \gamma I - \mu R \end{align} }[/math]
MSEIRS模型
MSEIRS 模型与 MSEIR 模型相似,但 r 类型的免疫效果是暂时的,因此当临时免疫结束时,个体将恢复其易感性。
- [math]\displaystyle{ {\color{blue}{\mathcal{M} \to \mathcal{S} \to \mathcal{E} \to \mathcal{I} \to \mathcal{R} \to \mathcal{S}}} }[/math]
可变接触率
众所周知,患病的概率在时间上并不是一成不变的。随着大流行的发展,相关应对措施可能会改变接触率,而较简单模型中将接触率假定为恒定。口罩、社交距离和封锁等应对措施将改变接触率,从而降低大流行的速度。
此外,有些疾病是季节性的,例如普通感冒病毒,这些病毒在冬季更为普遍。儿童疾病,如麻疹、腮腺炎和风疹,与上学日期有很强的相关性,因此在学校假期内患这种疾病的可能性大大降低。因此,对于许多种类的疾病,人们应该考虑周期性(“季节性”)变化接触率的感染力
- [math]\displaystyle{ F = \beta(t) \frac{I}{N} , \quad \beta(t+T)=\beta(t) }[/math]
周期T等于一年。
因此,我们的模型变成了
- [math]\displaystyle{ \begin{align} \frac{dS}{dt} & = \mu N - \mu S - \beta(t) \frac{I}{N} S \\[8pt] \frac{dI}{dt} & = \beta(t) \frac{I}{N} S - (\gamma +\mu ) I \end{align} }[/math]
(康复的动力学很容易从[math]\displaystyle{ R=N-S-I }[/math]得出),也就是具有周期变化参数的非线性微分方程组。众所周知,这类动力系统可能会出现非常有趣和复杂的非线性参数共振现象。显然,如果:
- [math]\displaystyle{ \frac 1 T \int_0^T \frac{\beta(t)}{\mu+\gamma} \, dt \lt 1 \Rightarrow \lim_{t \to +\infty} (S(t),I(t)) = DFE = (N,0), }[/math]
然而,如果积分大于1,疾病就不会消失,可能会有这样的共振。例如,将周期性变化的接触率作为系统的输入,输出是一个周期函数,其周期是输入周期的倍数。
这就可以解释某些传染病的每年(常见为两年)流行病爆发,是由于接触率振荡周期和地方病平衡点附近阻尼振荡的伪周期之间的相互作用。值得注意的是,在某些情况下,这种行为也可能是准周期的,甚至是混沌的。
疫苗接种模型
SIR 模型可以经过修改,对疫苗接种进行建模[15]
Typically these introduce an additional compartment to the SIR model, [math]\displaystyle{ V }[/math], for vaccinated individuals. Below are some examples.
Typically these introduce an additional compartment to the SIR model, [math]\displaystyle{ V }[/math], for vaccinated individuals. Below are some examples.
通常,在SIR 模型中引入一个额外的类别, [math]\displaystyle{ V }[/math] 为免疫类型。下面是一些例子。
新生儿疫苗接种
当出现传染病时,主要任务之一是通过预防措施消除传染病,或者如果可能的话,通过建立大规模疫苗接种计划消除传染病。假设一种新生儿疫苗(通过疫苗给予终身免疫力)接种率为 [math]\displaystyle{ P \in (0,1) }[/math]的疾病,:
- [math]\displaystyle{ \begin{align} \frac{dS}{dt} & = \nu N (1-P) - \mu S - \beta \frac{I}{N} S \\[8pt] \frac{dI}{dt} & = \beta \frac{I}{N} S - (\mu+\gamma) I \\[8pt] \frac{dV}{dt} & = \nu N P - \mu V \end{align} }[/math]
其中[math]\displaystyle{ V }[/math] 是指接种疫苗的人群。很快就可以看出:
- [math]\displaystyle{ \lim_{t \to +\infty} V(t)= N P, }[/math]
因此,我们需要处理[math]\displaystyle{ S }[/math]和[math]\displaystyle{ I }[/math]的长期行为,它认为:
- [math]\displaystyle{ R_0 (1-P) \le 1 \Rightarrow \lim_{t \to +\infty} \left(S(t),I(t)\right) = DFE = \left(N \left(1-P\right),0\right) }[/math]
- [math]\displaystyle{ R_0 (1-P) \gt 1 , \quad I(0)\gt 0 \Rightarrow \lim_{t \to +\infty} \left(S(t),I(t)\right) = EE = \left(\frac{N}{R_0(1-P)},N \left(R_0 (1-P)-1\right)\right). }[/math]
也就是说,如果
- [math]\displaystyle{ P \lt P^{*}= 1-\frac{1}{R_0} }[/math]
疫苗接种计划没有成功地根除这种疾病,相反,它将继续流行下去,尽管它的流行水平低于缺乏疫苗接种的情况。这意味着数学模型表明,对于基本再生数可能高达18的疾病,应该至少为94.4% 的新生儿接种疫苗,以根除这种疾病。
疫苗接种与信息
现代社会正面临着“理性”豁免的挑战,即家庭由于对感染风险的感知和对疫苗损害风险的“理性”比较,从而决定不给儿童接种疫苗。为了评估这种行为是否真的是理性的,也就是说,它是否同样能够根除疾病,人们可以简单地假定疫苗接种率是染病人群数量的递增函数:
- [math]\displaystyle{ P=P(I), \quad P'(I)\gt 0. }[/math]
在这种情况下,传染病根除的条件是:
- [math]\displaystyle{ P(0) \ge P^{*}, }[/math]
也就是说疫苗接种率基线应高于“强制接种”的阈值,而在豁免情况下,该阈值不能持续。因此,“合理的”豁免可能是短视的,因为它只是基于目前由于疫苗覆盖率高而发病率低的情况,而没有考虑到由于覆盖率下降而导致的未来感染死灰复燃的情况。
非新生儿疫苗接种
如果以接种率[math]\displaystyle{ ρ }[/math]为非新生儿接种疫苗,易感者和接种者的方程必须修改如下:
- [math]\displaystyle{ \begin{align} \frac{dS}{dt} & = \mu N (1-P) - \mu S - \rho S - \beta \frac{I}{N} S \\[8pt] \frac{dV}{dt} & = \mu N P + \rho S - \mu V \end{align} }[/math]
推导出以下的根除条件:
- [math]\displaystyle{ P \ge 1- \left(1+\frac{\rho}{\mu}\right)\frac{1}{R_0} }[/math]
脉冲疫苗接种策略
这一策略在一段时间内对易感人群中特定年龄群(如儿童或老年人)反复接种疫苗。利用这一策略,可立即消除易感人群,从而有可能从整个人群中消除传染病(如麻疹)。每[math]\displaystyle{ T }[/math]个时间单位,在相对较短的时间内(相对于疾病的动态),对一定比例[math]\displaystyle{ p }[/math]的易感受试者进行接种。这就得出了以下易感者和疫苗接种者的脉冲微分方程:
- [math]\displaystyle{ \begin{align} \frac{dS}{dt} & = \mu N - \mu S - \beta \frac{I}{N} S, \quad S(n T^+) = (1-p) S(n T^-), & & n=0,1,2,\ldots \\[8pt] \frac{dV}{dt} & = - \mu V, \quad V(n T^+) = V(n T^-) + p S(n T^-), & & n=0,1,2,\ldots \end{align} }[/math]
很容易看出,通过设置I = 0,可以通过以下方式获得易感个体的动态:
- [math]\displaystyle{ S^*(t) = 1- \frac{p}{1-(1-p)E^{-\mu T}} E^{-\mu MOD(t,T)} }[/math]
而根除条件是:
- [math]\displaystyle{ R_0 \int_0^T S^*(t) \, dt \lt 1 }[/math]
年龄的影响:年龄结构模型
年龄对疾病在人群中的传播速度有很大的影响,尤其是接触率。这个比率概括了易感人群和感染人群之间接触的有效性。考虑流行病不同类别人群的年龄[math]\displaystyle{ s(t,a),i(t,a),r(t,a) }[/math](限制在易感者-染病者-康复者的模型中) ,这样:
- [math]\displaystyle{ S(t)=\int_0^{a_M} s(t,a)\,da }[/math]
- [math]\displaystyle{ I(t)=\int_0^{a_M} i(t,a)\,da }[/math]
- [math]\displaystyle{ R(t)=\int_0^{a_M} r(t,a)\,da }[/math]
(其中[math]\displaystyle{ a_M \le +\infty }[/math] 是最大可接受的年龄) ,它们的动力学并不像人们想象的那样用“简单的”偏微分方程描述,而是用积分-微分方程描述:
- [math]\displaystyle{ \partial_t r(t,a) + \partial_a r(t,a) = -\mu(a) r(a,t) + \gamma(a)i(a,t) }[/math]
其中:
- [math]\displaystyle{ F(a,t,i(\cdot,\cdot))=\int_0^{a_M} k(a,a_1;t)i(a_1,t) \, da_1 }[/math]
是感染力,接触核心[math]\displaystyle{ k(a,a_1;t) }[/math]取决于年龄之间的相互作用。
新生婴儿的初始条件(即对于[math]\displaystyle{ a = 0 }[/math]) ,可以直接用于传染和康复:
- [math]\displaystyle{ i(t,0)=r(t,0)=0 }[/math]
但对于易感新生儿的密度来说,这是非局部的:
- [math]\displaystyle{ s(t,0)= \int_0^{a_M} \left(\varphi_s(a) s(a,t)+\varphi_i(a) i(a,t)+\varphi_r(a) r(a,t)\right) \, da }[/math]
其中,[math]\displaystyle{ \varphi_j(a), j=s,i,r }[/math]是成人的生育能力。
此外,现在定义总人口的密度[math]\displaystyle{ n(t,a)=s(t,a)+i(t,a)+r(t,a) }[/math] ,得到:
- [math]\displaystyle{ \partial_t n(t,a) + \partial_a n(t,a) = -\mu(a) n(a,t) }[/math]
在三个流行病类别中,最简单的相同生育情况下,为了实现人口均衡,我们需要以下充分必要条件,将生育率[math]\displaystyle{ \varphi(.) }[/math]与死亡率[math]\displaystyle{ \mu(a) }[/math]联系起来:
- [math]\displaystyle{ 1 = \int_0^{a_M} \varphi(a) \exp\left(- \int_0^a{\mu(q)dq} \right) \, da }[/math]
人口均衡是
- [math]\displaystyle{ n^*(a)=C \exp\left(- \int_0^a \mu(q) \, dq \right), }[/math]
能够自动保证无疾病时解的存在:
- [math]\displaystyle{ DFS(a)= (n^*(a),0,0). }[/math]
基本再生数可以通过求解适当的函数算子的谱半径来计算。
分区传染病模型中的其他考虑事项
垂直传染
就艾滋病和乙型肝炎等疾病而言,受感染父母的子女有可能在出生时就受到感染。这种从母体向下传染的疾病叫做垂直传染。在模型中,通过将一部分新生成员包括在染病人群中,可以在模型中考虑其他成员涌入染病类别人群的情况。[16]
水平传染
人与人之间间接传播的疾病,如通过蚊子传播的疟疾,通过中间媒介传播。在这些情况下,传染病会从人传播到昆虫,并且传播模型必须包括这两种物种,通常比直接传播模型需要更多的类别区分。[17]
其他
在建立流行病模型时可能需要考虑的其他事件包括以下事项:
- 不同类型的疾病混合
- 动态变化的传染率
- 空间上的不均匀分布
- 由大型寄生虫引起的疾病
确定性和随机流行病模型
必须强调的是,这里提出的确定性模型只有在人群数量足够大的情况下才有效,因此应该谨慎使用。[18]
更准确地说,这些模型仅在热力学极限中有效,在该热力学极限中,总体数量是无限大的。在随机模型中,由上述推导出的长期地方病平衡并不成立,因为在一个系统中,感染个体的数量下降到1以下的概率是有限的。在一个真正的系统中,病原体可能不会传播,因为没有宿主会被感染。但是,在确定性平均场模型中,被感染的病原体数量可以采用实数值,即被感染宿主的非整数值,模型中的宿主数量可以小于1,但大于零,从而使模型中的病原体得以繁殖。仓室模型的可靠性仅限于区分人群类别的应用。
平均场模型的一个可能的扩展是基于渗流理论的概念来考虑流行病在网络上的传播。[19]
参见
参考文献
- ↑ Kermack, W. O.; McKendrick, A. G. (1927). "A Contribution to the Mathematical Theory of Epidemics". Proceedings of the Royal Society A. 115 (772): 700–721. Bibcode:1927RSPSA.115..700K. doi:10.1098/rspa.1927.0118.
- ↑ Harko, Tiberiu; Lobo, Francisco S. N.; Mak, M. K. (2014). "Exact analytical solutions of the Susceptible-Infected-Recovered (SIR) epidemic model and of the SIR model with equal death and birth rates". Applied Mathematics and Computation (in English). 236: 184–194. arXiv:1403.2160. Bibcode:2014arXiv1403.2160H. doi:10.1016/j.amc.2014.03.030.
- ↑ Beckley, Ross; Weatherspoon, Cametria; Alexander, Michael; Chandler, Marissa; Johnson, Anthony; Batt, Ghan S. (2013). "Modeling epidemics with differential equations" (PDF). Tenessee State University internal report. Retrieved July 19, 2020.
- ↑ Yang, Wuyue; Zhang, Dongyan; Peng, Liangrong; Zhuge, Changjing; Liu, Liu (2020). "Rational evaluation of various epidemic models based on the COVID-19 data of China" (PDF). arXiv:2003.05666v1 (q-bio.PE). Retrieved July 19, 2020.
- ↑ Krylova, O.; Earn, DJ (May 15, 2013). "Effects of the infectious period distribution on predicted transitions in childhood disease dynamics". J R Soc Interface. 10 (84). doi:10.1098/rsif.2013.0098. Retrieved June 13, 2020.
- ↑ Hethcote H (2000). "The Mathematics of Infectious Diseases". SIAM Review. 42 (4): 599–653. Bibcode:2000SIAMR..42..599H. doi:10.1137/s0036144500371907.
- ↑ Bailey, Norman T. J. (1975). The mathematical theory of infectious diseases and its applications (2nd ed.). London: Griffin. ISBN 0-85264-231-8.
- ↑ Sonia Altizer; Nunn, Charles (2006). Infectious diseases in primates: behavior, ecology and evolution. Oxford Series in Ecology and Evolution. Oxford [Oxfordshire]: Oxford University Press. ISBN 0-19-856585-2.
- ↑ Wolfram Research, Inc. "Mathematica, Version 12.1". Champaign IL, 2020.
- ↑ Capasso, V. (1993). Mathematical Structure of Epidemic Systems. Berlin: Springer. ISBN 3-540-56526-4.
- ↑ Miller, J.C. (2012). "A note on the derivation of epidemic final sizes". Bulletin of Mathematical Biology. 74 (9). section 4.1. doi:10.1007/s11538-012-9749-6. PMC 3506030. PMID 22829179.
- ↑ Miller, J.C. (2017). "Mathematical models of SIR disease spread with combined non-sexual and sexual transmission routes". Infectious Disease Modelling. 2 (1). section 2.1.3. doi:10.1016/j.idm.2016.12.003. PMC 5963332. PMID 29928728.
- ↑ Hethcote, Herbert W. (1989). "Three Basic Epidemiological Models". In Levin, Simon A.; Hallam, Thomas G.; Gross, Louis J.. Applied Mathematical Ecology. Biomathematics. 18. Berlin: Springer. pp. 119–144. doi:10.1007/978-3-642-61317-3_5. ISBN 3-540-19465-7.
- ↑ The first and second differential equations are transformed and brought to the same form as for the SIR model above.
- ↑ Gao, Shujing; Teng, Zhidong; Nieto, Juan J.; Torres, Angela (2007). "Analysis of an SIR Epidemic Model with Pulse Vaccination and Distributed Time Delay". Journal of Biomedicine and Biotechnology. 2007. Retrieved July 19, 2020.
- ↑ Brauer, F.; Castillo-Chávez, C. (2001). Mathematical Models in Population Biology and Epidemiology. NY: Springer. ISBN 0-387-98902-1.
- ↑ For more information on this type of model see Anderson, R. M., ed. (1982). Population Dynamics of Infectious Diseases: Theory and Applications. London-New York: Chapman and Hall. ISBN 0-412-21610-8.
- ↑ Bartlett MS (1957). "Measles periodicity and community size". Journal of the Royal Statistical Society, Series A. 120 (1): 48–70. doi:10.2307/2342553. JSTOR 2342553. S2CID 91114210.
- ↑ Croccolo F. and Roman H.E. (2020). "Spreading of infections on random graphs: A percolation-type model for COVID-19". Chaos, Solitons & Fractals. 139: 110077. doi:10.1016/j.chaos.2020.110077.
深入阅读
- May, Robert M.; Anderson, Roy M. (1991). Infectious diseases of humans: dynamics and control. Oxford: Oxford University Press. ISBN 0-19-854040-X.
- Vynnycky, E.; White, R. G., eds. (2010). An Introduction to Infectious Disease Modelling. Oxford: Oxford University Press. ISBN 978-0-19-856576-5.
外部链接
- "Simulating an epidemic". 3Blue1Brown. March 27, 2020 – via YouTube.
编辑推荐
集智文章推荐
美国新冠病毒肺炎流行病如何引发种族仇恨 | 网络科学论文速度36篇
本中文词条由Agnes 参与编译, Zcy 审校,不是海绵宝宝编辑,欢迎在讨论页面留言。
本词条内容源自wikipedia及公开资料,遵守 CC3.0协议。


