点击流网络的耗散与异速增长
Abstract
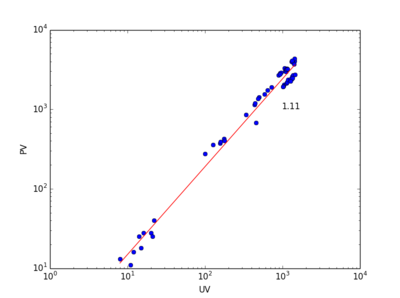
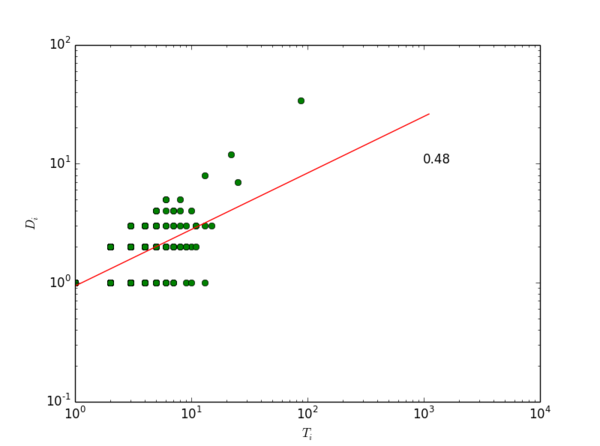
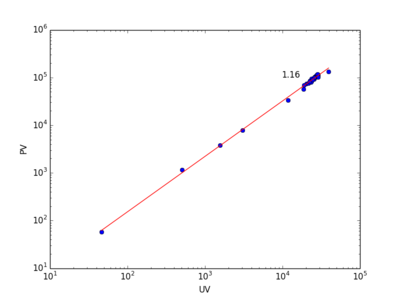
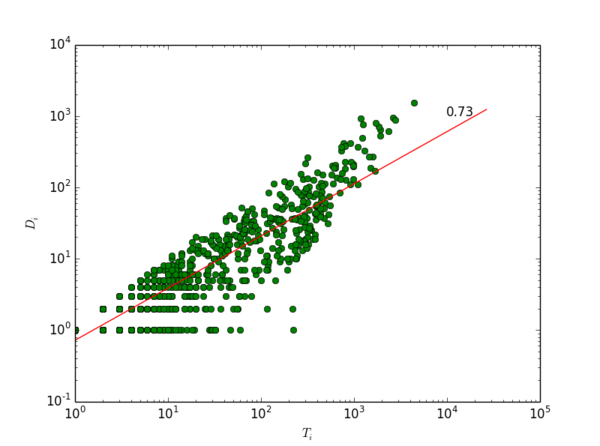
通过点击流网络在空间上的耗散律 [math]\displaystyle{ D_i=T_i^{\eta} }[/math] 来预测网络在时间上的增长 [math]\displaystyle{ PV=UV^{\theta} }[/math] 根据我们的数学推论,当 [math]\displaystyle{ \eta\gt 1 }[/math] 时, [math]\displaystyle{ \frac{1}{\eta}\lt \theta\lt 1 }[/math] ;当 [math]\displaystyle{ 0\lt \eta\lt 1 }[/math] 时, [math]\displaystyle{ 1\lt \theta\lt \frac{1}{\eta} }[/math] 。
数据集
1000个Baidu 贴吧
数据源
内部数据,只能用于研究用,不公开。
数据预处理
    import sys
    import glob
    import zipfile
    import numpy as np
    import statsmodels.api as sm
    import matplotlib.pyplot as plt
    from collections import defaultdict
    import matplotlib.mlab as mlab

    #===========allometric scaling==================
    #------import hourly uvpv data of 993 forums------------
    t = {}
    with open ('/Users/csid/Documents/bigdata/tiebahourlynetworkstat.txt', 'rb') as f:
        for line in f:
            line = line.strip().split('\t')
            t[line[0]]=np.array(line[1:]).astype('int').reshape(2784/2,2)

    #------fit allometric exponents---------
    b=[]
    for i in t:
        uv,pv = t[i].T
        b.append(alloRegressFit(uv,pv))

    #------plot allometric scaling----------
    fig = plt.figure(figsize=(10, 5),facecolor='white')
    ax = fig.add_subplot(1,2,1)
    # demo allometric
    uv,pv = t[ns[100]].T
    alloRegressPlot(uv,pv*50,'c','o','UV','PV')
    uv,pv = t[ns[502]].T
    alloRegressPlot(uv,pv*5,'g','o','UV','PV')
    uv,pv = t[ns[902]].T
    alloRegressPlot(uv,pv,'gold','o','UV','PV')
    plt.legend(numpoints=1,fontsize=12)
    plt.xlim(100,2*10**4)
    ax = fig.add_subplot(1,2,2)
    histogram(b,30,'RoyalBlue',r'$\theta$')
    plt.tight_layout()
    plt.show()

    #===========dissipation law ==================

    #------------get name list----------------
    names=[]
    f = open("/Users/csid/Documents/research/The Scaling of Attention Networks/top1000", "rb")
    for line in f.readlines():
        line = line.strip()
        names.append(line)
    f.close()
    blacklist={}
    for i in names[:20]:
        blacklist[i]=0

    # ------get the constant coefficient and scaling exponnet of di vs ti from zipped files containing 1000 daily flow networks-------
    def calculateGamma(data):
        dt = defaultdict(lambda:[0,0])# key:thread; value:[di, ti]
        for From,To in data:
            dt[From][1]+=1
            if To == 's':
                dt[From][0]+=1
        di,ti=np.array([i for i in dt.values() if i[0]>0 and i[1]>0]).T
        b, gamma, r = OLSRegressFit(np.log(ti),np.log(di))
        return b, gamma, r

    def stat(ad,num):
        z = zipfile.ZipFile(ad, 'r')
        for k in z.namelist():
            if k in blacklist:
                continue
            try:
                f = z.read(k).split('\n')
                flushprint(str(num)+'__'+str(z.namelist().index(k)))
                Hour = ''
                data = []
                for line in f:
                    line = line.strip().split('\t')
                    if len(line)!=3:
                        continue
                    hour, From, To = line
                    if hour == Hour:
                        data.append([From,To])
                    else:
                        if Hour:
                            D[k].append(calculateGamma(data))
                        Hour = hour
                        data = []
                D[k].append(calculateGamma(data))
            except:
                pass

    #-------go-------------
    D=defaultdict(lambda:[])
    ads = glob.glob("/Users/csid/Documents/bigdata/tiebadailynetwork/*")
    for ad in ads:
        n=ads.index(ad)
        stat(ad,n)
异速增长
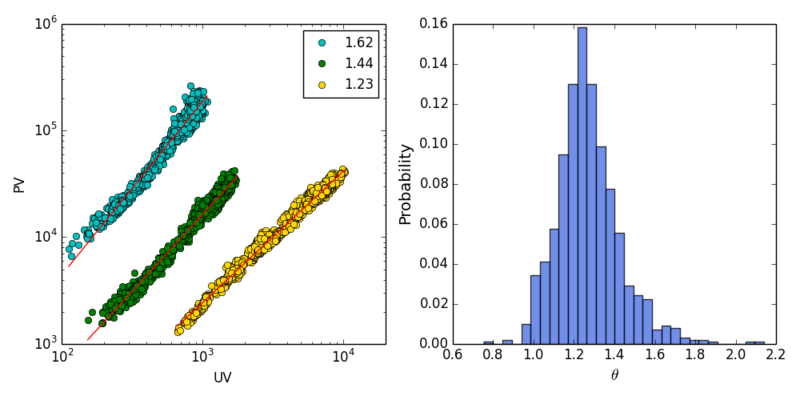
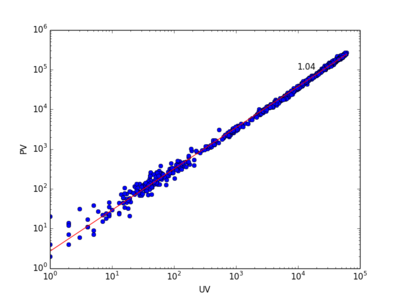
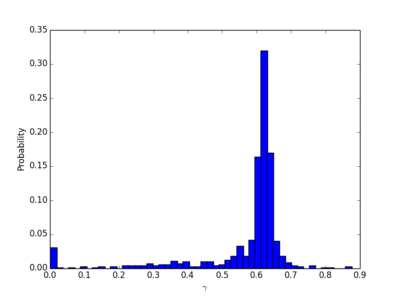
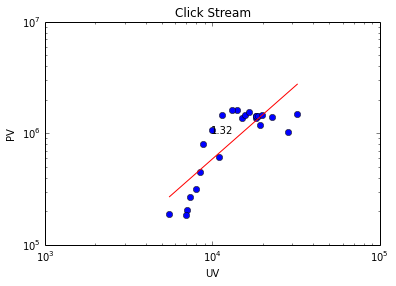
上图左展示了三个贴吧在1392小时内的PV vs. UV的关系。不同吧的数据点被整体平移以便于观察。右图展示了1000个贴吧的异速增长指数[math]\displaystyle{ \theta }[/math]的分布,均值为1.28,方差为0.17。
耗散
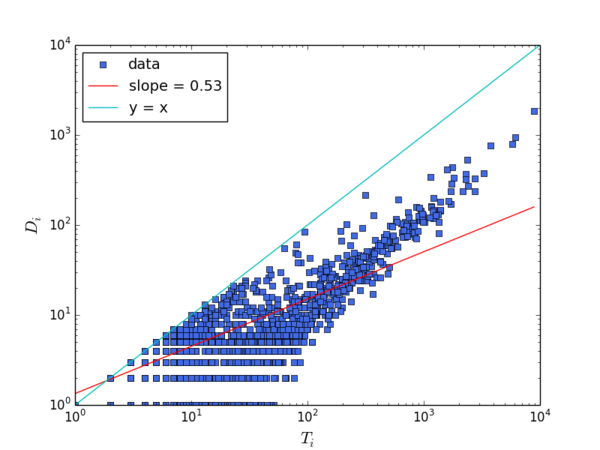
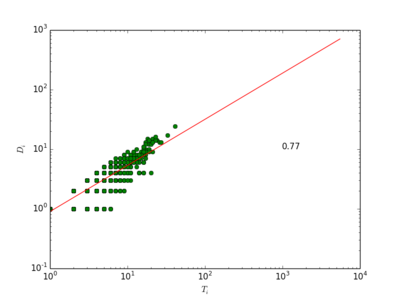
上图显示了某吧在2013年2月28日0点的一个小时内的耗散率。需要注意的是,我们在这里并没有使用“log-bin”方法来消除拟合耗散率Di vs. Ti数据中的“噪音”。一般来说在Di vs. Ti图上,横轴“左下方”比“右上方”肥大,这是因为虽然大多数节点的耗散量Di 随直接流量Ti增长,但仍然有一部分节点直接流量(横轴)较大,耗散量(纵轴)却很小。这就导致数据点“左下方”有点散。
我们认为,对于网络的流结构,这种数据分布并不是噪音,而是信息。因为它告诉我们网络中是否存在一些对耗散没有贡献,直接流量却比较大的节点。这种节点越多,网络的耗散能力越低,相应地,流的储运能力就越高。因此,这种点的存在,会降低[math]\displaystyle{ \eta }[/math],提升[math]\displaystyle{ \theta }[/math]。如果使用log-bin,即在对数坐标系下,将一定范围内的数据点求均值以带代替原始数据,这部分信息就消失了。所以,直接使用对数坐标系下ols回归估计得到的[math]\displaystyle{ \eta }[/math],它与[math]\displaystyle{ \theta }[/math]之间的关系,要比经过“log-bin”方法处理后得到的[math]\displaystyle{ \eta }[/math],与[math]\displaystyle{ \theta }[/math]之间的关系更符合我们的逻辑推理(两者负相关)和数学推导([math]\displaystyle{ \theta }[/math]的边界为[math]\displaystyle{ 1/\eta }[/math])。
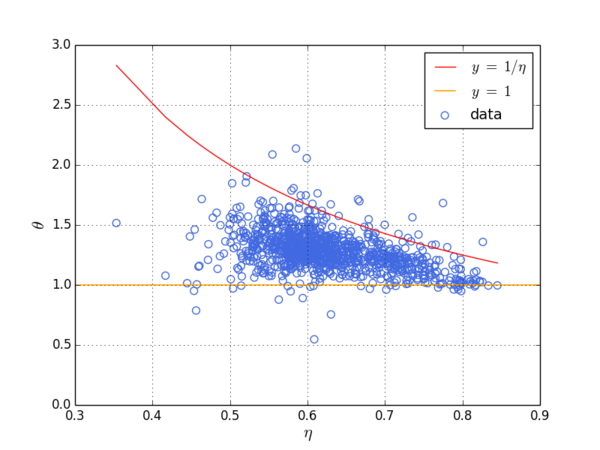
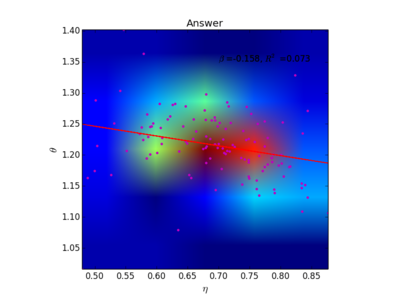
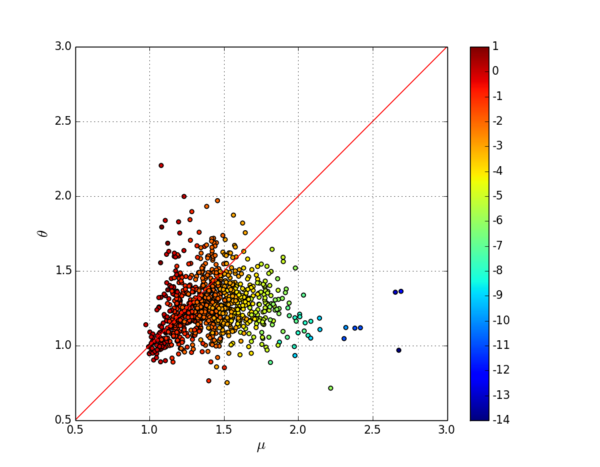
上图中展示了排名前1000的百度贴吧的数据。每个贴吧是一个数据点。对于每个贴吧我们构建了57(天)* 24 = 1392个小时级点击流网络,纵轴所显示的 [math]\displaystyle{ \theta }[/math] 是一个贴吧在1392个小时中的PV vs. UV的异速增长指数。横轴显示的 [math]\displaystyle{ \eta }[/math] 是一个贴吧在每个小时的点击流网络中所形成的耗散率Di vs. Ti中的指数 [math]\displaystyle{ \eta_t }[/math] 经过1392个小时平均之后得到的均值。因为这1000个贴吧的耗散指数 [math]\displaystyle{ \eta }[/math] 均小于1,所以我们预测有 [math]\displaystyle{ 1\lt \theta\lt 1/\eta }[/math] 。我们发现实证数据支持我们的预测,大部分贴吧的 [math]\displaystyle{ \theta }[/math] 均位于1(黄线)和 [math]\displaystyle{ 1/\eta }[/math] (红线)之间。
耗散与流距离的关系
上图计算了24个小时级lol吧,耗散和流量随着节点到源的距离变化而变化。
排名前1000的贴吧彼此之间的点击流流动
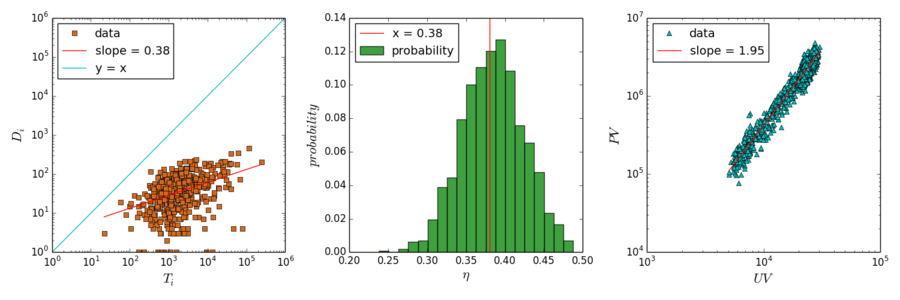
之前分析的点击流网络节点是帖子,现在我们考虑以吧为节点的点击流网络。我们搜集了排名前1000的贴吧彼此之间的点击流,从20130227到20130427一共构成60*24=1440个小时级点击流网络。这个网络的耗散与异速增长见上图。左图展示了一个小时网络的耗散律示例,中图展示了耗散指数的分布,均值为0.38,右图展示了异速增长指数。我们发现,本例中[math]\displaystyle{ 1\lt \theta=1.95\lt 1/\eta=2.65 }[/math],仍然满足我们的推论。
将贴吧内部的(帖子之间的)点击流与贴吧之间的点击流比较,颇有意思。我们发现贴吧之间的点击流耗散要更小,异速增长指数也因此更大。
Top1000网站之间的点击流网络
数据源
从2012年4月起,分三次获得的三个世界排名前1000的网站之间的点击流。首先从Alexa或者Google ADplanner(现在已经停止服务)上获得世界排名前1000的网站名单,然后从Alexa上获得每个网站的10个上家和10个下家,构成点击流网络。虽然每个网站最多有20个link,但因为多个网站可以指向同一个网站,网络中的度分布和流量分布仍然是长尾分布。网络alexaflowweb20120404有1189个节点,17061条边;网络googleflowweb20101222有979个节点,11906条边; 网络googleflowweb20120404有956节点,11529条边。三个网络的耗散与异速增长见下图。
耗散
见下图
异速增长
GithubArchive数据
数据源
从http://www.githubarchive.org/这里可以下载github自2011年2月12日到现在的数据。数据以Json的压缩包形式提供(截至2014-07-16,数据的物理体积为56G)。每一个小时一个数据文件,例如2012年3月11日12点的数据文件为:http://data.githubarchive.org/2012-03-11-12.json.gz。
数据下载 根据这个特点,可以构造随时间变化的所有下载链接并获取相应数据。在githubarchive网站提供了ruby的下载数据方式。虽然谷歌的bigquery也提供了迅速计算该数据的方法,但有计算量和分析方式的限制,适合于做数据的描述性分析,而不是深入的数据挖掘。此处推荐熟悉python的研究者使用编写python script的形式下载数据,可参考Mazieres所编写的python代码,见这里:https://github.com/mazieres/github_archive 。数据下载之后,可以较为自由地分割数据并进行处理。
数据预处理
把数据按照行为的类别(types)分解,获取每种行为的 actor, 对应的repo,和时间。每个类别的行为存放在一个文件夹,一天一个数据文件。
import json

def saveData(ad):
    f = gzip.open(ad, 'rb')
    f = f.read().split(' ')
    num = 0
    for line in f:
        num += 1
        try:
            line = json.loads(line)
            types = line['type']
            if 'repo' in line:
                repo = line['repo']['name']
                actor = line['actor']['login']
            else:
                repo = line['repository']
                repo = repo['owner'] + '/' + repo['name']
                actor = line['actor']
            time = line['created_at']
            date = time[0:10]
            ts = time[11:19].split(':')
            ts = ts[0] + ts[1] + ts[2]
            record = actor+"\t"+repo +"\t"+ts
            newpath = path +'days/'+ types  + '/'
            if not os.path.exists(newpath): os.makedirs(newpath)
            with open(newpath + date,'a') as p:
                p.write(record+"\n")
        except:
            pass

path='D:/chengjun/githubArchive/'
ads = glob.glob(path + "*")
ads = [f for f in ads if f[-2:] == 'gz']
ads =[f for f in ads if f[41:45] == '2012' and int(f[46:48]) > 6]
for ad in ads:
    n=ads.index(ad)
    print n, ad
    saveData(ad)
异速增长
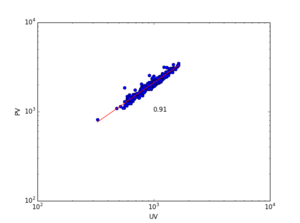
theta = 0.91
耗散
size-adjusted fit
这里首先处理的数据是watchevent这个Github的数据,因为2012年的json数据缺少换行符,所以这里仅仅用了2011年的数据。
print a, b, Dmax_mean, Tmax_mean
-0.0920496995988 1.03953019774 979.845201238 3039.10835913
110个Stack Exchange子站点
数据源
从这里可以下载建站5年的问答数据,大约46G,包括70万用户
数据预处理
#========构建问答注意力流网络,以下代码运行完在4小时左右========#
1. 每个子网站分别处理
2. 按天拆分数据
3. 天的数据按人和分钟时间排序
4. 天的数据构造流网络
5. 流网络加入sink
6. 使用之前的处理方法。

# --------get all site names---------
path='F:/attention flow/stackexchange/unzip/'
sites = [ f for f in listdir(path) if f[-1]=='m']
sites.append('mathoverflow.net')
sites.append('stackoverflow.com-Posts')

# 1. split data into daily subset
def splitDailyData(site): # site = sites[0]
    filename = path + site + '/Posts.xml'
    with open(filename,'r') as f:
        newpath = path + site + '/post_days/'
        if not os.path.exists(newpath): os.makedirs(newpath)
        for line in f:
            try:
                label = line.split('PostTypeId=')[1][1:2]
                if label == '2':
                    date = line.split('CreationDate=')[1][1:11]
                    author = line.split('OwnerUserId=')[1].split(r'"')[1]
                    questionID = line.split('ParentId=')[1].split(r'"')[1]
                    ts = line.split('CreationDate=')[1][12:20].split(':')
                    ts = ts[0] + ts[1] + ts[2]
                    record = author+"\t"+questionID+"\t"+ts
                    with open(newpath + date,'a') as p: # '''Note''':Append mode, you can run only once!
                            p.write(record+"\n")
            except:
                pass

for i in sites:
    print sites.index(i), i
    splitDailyData(i)
数据预处理:排序、转网、加汇
import os
from os import listdir
import glob

import os
# --------get all site names---------
path='D:/stackoverflow/unzip/'
sites = [ f for f in os.listdir(path) if f[-1]=='m']
sites.append('mathoverflow.net')
sites.append('stackoverflow.com-Posts')

def saveData(file_name, trunk):
    with open(file_name, 'a') as g:
        for t in trunk:
            t = str(t[0])+'\t'+t[1]+'\t'+t[2]
            g.write(str(t)+"\n")
            #print t

def sortData(i):
    upt = []
    with open(i) as f:
        for line in f:
            try:
                user, post, time = line.strip().split('\t')
                time = int(time)
                user = int(user)
                upt.append([user, post, time])
            except:
                pass
        upt = sorted(upt, key = lambda x: (x[0], x[2]))
        return upt

def buildNetwork(data, uid): # data format [1, 2, 3, 4]
    trunk = []
    if len(data)>1:
        for i in xrange(len(data) - 1):
            From, To = data[i], data[i + 1]
            trunk.append([uid, From, To])
        trunk.append([uid, trunk[-1][2], 's'])
    elif len(data) ==1:
        trunk = [[uid, data[0], 's']]
    else:
        pass
    return trunk

#data  = [1]
#user = "a"
#t = buildNetwork(data, user)

def transformData(site): # site = sites[0]
     file_path = path + site + '/post_days/*'
     files = glob.glob(file_path)
     newpath = path + site + '/post_days_network_with_sink/'
     if not os.path.exists(newpath): os.makedirs(newpath)
     for i in files: # i = files[3]
            # 1. sort data
            upt = sortData(i)
            # 2. construct flow network, Format: user From To
            date = i[-10:]
            file_name = newpath + date
            user = upt[0][0]
            data = []
            for x in upt:
                person, post, time = x
                if person ==user:
                    data.append(post)
                else: # person != user: # a new trunk add sink
                    block = buildNetwork(data, user)
                    saveData(file_name, block)
                    user = person
                    data = []
                    data.append(post) # mind here!!!
            block = buildNetwork(data, user)
            saveData(file_name, block)

print sites[0]
transformData(sites[0])
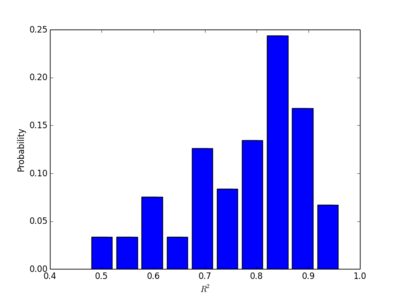
异速增长
from os import listdir
import glob
from collections import defaultdict
import numpy as np

'''
# allometric growth
# get uv and pv
'''
import statsmodels.api as sm
def alloRegressFit(xdata,ydata):
    x=np.log(xdata+1);y=np.log(ydata+1);
    xx = sm.add_constant(x, prepend=True)
    res = sm.OLS(y,xx).fit()
    beta=res.params[1]; r2=res.rsquared
    return beta, r2


def saveAlloBeta(file_name, siteBetaR2):
    with open(file_name, 'a') as g:
        g.write(siteBetaR2+"\n")

def calAlloBeta(sites):
    num = 0
    for i in sites:
        sitePath = path+ i +"/post_days_network_with_sink/*"
        ads = glob.glob(sitePath)
        E = defaultdict(lambda:[])
        for dat in ads:
            with open(dat) as f:
                users = []
                PV = 0
                for line in f:
                    person, From, To = line.strip('\n').split('\t')
                    if To != 's':
                        PV += 1
                        users.append(person)
                UV = len(set(users))
                E[dat[-10:]].append([PV, UV])
        pv, uv=np.array(E.values()).T
        beta, r2 = alloRegressFit(uv[0], pv[0]) #注意:我在这里犯了一次错误!!!已经捕捉这个bug#
        siteBetaR2 = i+'\t'+str(beta)+'\t'+str(r2)
        saveAlloBeta(file_name, siteBetaR2)
        num += 1
        print siteBetaR2, num


# --------Run: get all site names---------
path='D:/stackoverflow/unzip/'
sites = [ f for f in listdir(path) if f[-1]=='m'] # .com
sites.append('mathoverflow.net')
sites.append('stackoverflow.com-Posts')
# file for saving the sitename, beta, R square
file_name = path + 'allo_site_beta_rsquare'
# Run
calAlloBeta(sites)


# plot
file_path='D:/stackoverflow/unzip/allo_site_beta_rsquare'
with open(file_path) as f:
    betas = []
    r2s = []
    for line in f:
        site, beta, r2 = line.strip('\n').split('\t')
        betas.append(float(beta))
        r2s.append(float(r2))

def plotHist(variable, xlab):
    # variable = betas
    # variable = variable[~np.isnan(variable)]
    y, x = np.histogram(variable, 50, density = True)
    yn = y/sum(y)
    plt.bar(x[:-1], yn, width = 0.002)
    plt.xlabel(xlab)
    plt.ylabel("Probability")
    plt.show()

plotHist(betas,  r'$\beta$')
plotHist(r2s,  r'$R^2$')
Stackexchange 109个社区中的回答问题行为中的PV与UV
Stackexchange 109个社区中的评论行为中的PV与UV
耗散
from os import listdir
import glob
from collections import defaultdict
import numpy as np
import statsmodels.api as sm

"""
dissipation law
"""


def OLSRegressFit(x,y):
   xx = sm.add_constant(x, prepend=True)
   res = sm.OLS(y,xx).fit()
   constant, beta = res.params
   r2 = res.rsquared
   return [constant, beta, r2]

# get the constant coefficient and scaling exponnet of di vs ti
def calculateGamma(data):
    dt = defaultdict(lambda:[0,0])# key:thread; value:[di, ti]
    for From,To in data:
        dt[From][1]+=1
        if To == 's':
            dt[From][0]+=1
    di,ti=np.array([i for i in dt.values() if i[0]>0 and i[1]>0]).T
    b, gamma, r = OLSRegressFit(np.log(ti),np.log(di))
    return b, gamma, r


def stat(ad):
    with open(ad) as f:
        try:
            data = []
            for line in f:
                line = line.strip('\n').split('\t')
                From, To = line[1:]
                data.append([From,To])
            D[ad[-10:]].append(calculateGamma(data))
        except:
            pass

def saveDisGamma(file_name, siteGammaR2):
    with open(file_name, 'a') as g:
        g.write(siteGammaR2+"\n")


# --------Run: get all site names---------
path='D:/chengjun/stackexchange/unzip/'
sites = [ f for f in listdir(path) if f[-1]=='m'] # .com
sites.append('mathoverflow.net')
sites.append('stackoverflow.com-Posts')
num = 0
file_path = path + 'dis_site_gamma_rsquare'


for site in sites:
    num += 1
    print num, site
    sitePath = path+ site +"/post_days_network_with_sink/*"
    ads = glob.glob(sitePath)
    D=defaultdict(lambda:[])
    for ad in ads: # ad = ads[0]
        stat(ad)
    Dlist = [i[0] for i in D.values() if i]
    b,gamma,r = np.array(Dlist).T
    r_no_na =  [x for x in r if str(x) != 'nan' and str(x)!= '-inf']
    gamma_no_na =  [x for x in gamma if str(x) != 'nan' and str(x)!= '-inf']
    rMean = np.mean(r_no_na)
    gammaMean = np.mean(gamma_no_na)
    siteGammaR2 = site + '\t' +str(gammaMean) +'\t'+ str(rMean)
    saveDisGamma(file_path, siteGammaR2)

## --------Run: get all site names---------
file_path_theta='D:/stackoverflow/unzip/allo_site_beta_rsquare'
file_path_eta='D:/stackoverflow/unzip/dis_site_gamma_rsquare'

with open(file_path_theta) as f:
    theta = []
    r2t = []
    for line in f:
        site, beta, r2 = line.strip('\n').split('\t')
        theta.append(float(beta))
        r2t.append(float(r2))

with open(file_path_eta) as f:
    eta = []
    r2e = []
    for line in f:
        site, beta, r2 = line.strip('\n').split('\t')
        eta.append(float(beta))
        r2e.append(float(r2))

import matplotlib.pyplot as plt
def plotHist(variable, xlab):
    # variable = betas
    # variable = variable[~np.isnan(variable)]
    y, x = np.histogram(variable, 15, density = True)
    yn = y/sum(y)
    plt.bar(x[:-1], yn, width = 0.03)
    plt.xlabel(xlab)
    plt.ylabel("Probability")
    plt.show()


plotHist(theta,  r'$\theta$')
plotHist(r2t,  r'$R^2$')
plotHist(eta,  r'$\eta$')
plotHist(r2e,  r'$R^2$')
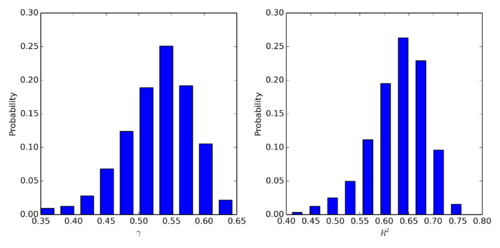
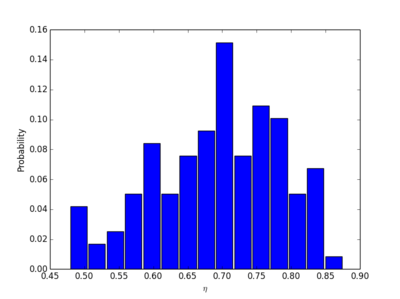
Stackexchange 109个社区中的回答问题注意力网络的耗散
Stackexchange 109个社区中的评论问题注意力网络的耗散
热图
import statsmodels.api as sm
def OLSRegressHeatPlot(x,y,xlab,ylab,resolution):
#    x = eta
#    y = theta
#    xlab = r'$\eta$'
#    ylab = r'$\theta$'
#    resolution = 5
    heatmap, xedges, yedges = np.histogram2d(x, y, bins=resolution)
    extent = [xedges[0], xedges[-1], yedges[0], yedges[-1]]
    xx = sm.add_constant(x, prepend=True)
    res = sm.OLS(y,xx).fit()
    constant, beta = res.params
    r2 = round(res.rsquared, 3)
    beta = round(beta, 3)
    inset = r'$\beta$ =' + str(beta) + ', ' + r'$R^2$ =' + str(r2)
    plt.plot(x,y,".",color="m")
    plt.text(0.7, 1.35, inset)
    plt.title('Answer')
    plt.show()
    plt.imshow(heatmap[:,::-1].T, extent=extent)
    fx = constant + np.multiply(x, beta)
    plt.plot(x,  fx, color = "r")
    plt.axis(extent)
    plt.xlabel(xlab,size=15)
    plt.ylabel(ylab,size=15)

OLSRegressHeatPlot(eta,theta, '\eta', '\theta', 100)
size-adjusted fit
Delicious
数据源
从这里可以下载Delicious建站4年的标注数据,大约5G,包括50万用户
我使用了计算士整理的Flickr和Delicious的数据。格式为:user, From, To。这个数据里没有加入汇(sink),所以需要经过数据预处理,加入sink。
异速增长
代码同下面flickr部分的代码。只需改动文件夹名称即可。
耗散
代码同Flickr部分
size-adjusted fit
代码同flickr的size-adjusted fit部分,不再重复
print a, b, Dmax_mean, Tmax_mean
0.745416857615 0.166669488526 166.959016393 502.524590164
Flickr
数据源
从这里可以下载Flickr建站2年的标注数据,大约5G,包括30万用户
数据预处理
我使用了计算士整理的Flickr和Delicious的数据。格式为:user, From, To。这个数据里没有加入汇(sink),所以需要经过数据预处理,加入sink。
import glob
ads = glob.glob("F:/attention flow/flickr/days/*")

def Print(Name,data):
    with open("F:/attention flow/flickr/days_with_sink/" + Name, 'wb') as p:
        for i in data:
            print >> p, "%s\t%s"%(i[0], i[1])


def addSink(files):
    num = 0
    for dat in files:
        num += 1
        print num, dat[-14:-4]
        with open(dat) as f:
            user = ''
            data = []
            for line in f:
                line = line.strip().split('\t')
                if len(line)!=3:
                    pass
                person, From, To = line
                data.append([From,To])
                if person != user:
                    try:
                        data.append([data[-1][1], 's'])
                    except:
                        pass
                    user = person
            data.append([data[-1][1], 's'])
            Print(dat[-14:-4],data)

addSink(ads)
异速增长
注意:计算异速增长的时候依然使用没有加入sink的数据格式。
'''
# allometric growth
# get uv and pv
'''

import glob
ads = glob.glob("F:/attention flow/flickr/days/*")

E = defaultdict(lambda:[])
for dat in ads:
    with open(dat) as f:
        users = []
        PV = 0
        for line in f:
            user = line.strip('\n').split('\t')[0]
            PV += 1
            users.append(user)
        UV = len(set(users))
        E[dat[-14:-4]].append([PV, UV])
        print dat[-14:-4]

pv, uv=np.array(E.values()).T
耗散
"""
dissipation law
"""
# get the constant coefficient and scaling exponnet of di vs ti
def calculateGamma(data):
    dt = defaultdict(lambda:[0,0])# key:thread; value:[di, ti]
    for From,To in data:
        dt[From][1]+=1
        if To == 's':
            dt[From][0]+=1
    di,ti=np.array([i for i in dt.values() if i[0]>0 and i[1]>0]).T
    b, gamma, r = OLSRegressFit(np.log(ti),np.log(di))
    return b, gamma, r


def stat(ad):
    with open(ad) as f:
        try:
            data = []
            for line in f:
                line = line.strip('\n').split('\t')
                if len(line)!=2:
                    continue
                From, To = line
                data.append([From,To])
            D[ad[-10:]].append(calculateGamma(data))
        except:
            pass
# run
D=defaultdict(lambda:[])
import glob
ads = glob.glob("F:/attention flow/flickr/days_with_sink/*")
for ad in ads:
    n=ads.index(ad)
    print ad[-10:], n
    stat(ad)

# plot the histogram
Dlist = [i[0] for i in D.values() if i]
b,gamma,r = np.array(Dlist).T

def plotHist(variable, xlab):
    variable = variable[~np.isnan(variable)]
    y, x = np.histogram(variable, 50, density = True)
    yn = y/sum(y)
    plt.bar(x[:-1], yn, width = 0.02)
    plt.xlabel(xlab)
    plt.ylabel("Probability")
    plt.show()

plotHist(gamma,  r'$\gamma$')
plotHist(r,  r'$R^2$')
size-adjusted fit
import numpy as np
from collections import defaultdict
import networkx as nx
from numpy import log, mean

'''
# Network balancing
'''

def flowBalancing(G):
    RG = G.reverse()
    H = G.copy()
    def nodeBalancing(node):
        outw=0
        for i in G.edges(node):
            outw+=G[i[0]][i[1]].values()[0]
        inw=0
        for i in RG.edges(node):
            inw+=RG[i[0]][i[1]].values()[0]
        deltaflow=inw-outw
        if deltaflow > 0:
            H.add_edge(node, "sink",weight=deltaflow)
        elif deltaflow < 0:
            H.add_edge("source", node, weight=abs(deltaflow))
        else:
            pass
    for i in G.nodes():
        nodeBalancing(i)
    if ("source", "source") in H.edges():  H.remove_edge("source", "source")
    if ("sink", "sink") in H.edges(): H.remove_edge("sink", "sink")
    return H

'''
# network data preprocessing
'''

def constructFlowNetwork (ad):
    with open(ad) as f:
        E = defaultdict(int)
        for line in f:
            From, To = line.strip('\n').split('\t')
            if To == 's':
                To = 'sink'
            E[From,To] += 1
    G=nx.DiGraph()
    for i,j in E.items():
        x,y=i
        G.add_edge(x,y,weight=j)
    return G


'''
# get flow distance
'''
def toSink(G, i):
        try:
            di = G[i]['sink'].values()[0]
        except:
            di = 0
        return di

def flowDistanceDT(G): #input a balanced nx graph
    R = G.reverse()
    mapping = {'source':'sink','sink':'source'}
    H = nx.relabel_nodes(R,mapping)
    #---------initialize flow distance dict------
    L = dict((i,1) for i in G.nodes())  #FlowDistance
    #---------prepare weighted out-degree dict------
    D = {i: toSink(G, i) for i in G.nodes()} #Di
    T = G.out_degree(weight='weight')        #Ti
    #---------iterate until converge------------
    ls = np.array(L.values())
    delta = len(L)*0.01 + 1
    while delta > len(L)*0.01:
        for i in L:
            l=1
            for m,n in H.edges(i):
                l+=L[n]*H[m][n].values()[0]/float(T[m])
            L[i]=l
        delta = sum(np.abs(np.array(L.values()) - ls))
        ls = np.array(L.values())
    #---------clean the result-------
    del L['sink']
    for i in L:
        L[i]-=1
    L['sink'] = L.pop('source')
    T['sink'] = T.pop('source')
    D['sink'] = D.pop('source')
    return L.values(), D.values(), T.values()

def prepocessingData(G):
    # G = h
    fd, di, ti = flowDistanceDT(G)
    # sort data.frame
    mt = np.array([fd, di, ti]).T
    mts = sorted(mt.tolist(), key = lambda x: x[0])
    fd, di, ti = np.array(mts).T
    # get sum values
    Drmax = sum(di)
    Dmax = sum(di)
    Tmax = sum(ti)
    r_index = [index for index, v in enumerate(fd)]
    di_cum = [ sum(di[:i+1]) for i in r_index]
    # replace zero with a small number
    for k, i in enumerate(di_cum):
        if i==0:
            di_cum[k] = 0.000001
        else:
            pass
    # regression
    ti_cum = [ sum(ti[:i+1]) for i in r_index]
    di_cum_log = log(di_cum)
    ti_cum_log = log(ti_cum)
    Drmax_log = [log(Drmax) for i in range(len(r_index))]
    return ti_cum_log, di_cum_log, Drmax_log, Dmax, Tmax

def sizeAdjustedFit(ti_cum_log, di_cum_log, Drmax_log):
    import statsmodels.api as sm
    x = sm.add_constant(di_cum_log)
    X = np.column_stack((x, Drmax_log))
    model = sm.OLS(ti_cum_log, X)
    res = model.fit()
    b, a = res.params[1:]
    return a, b


'''
# run
'''
import glob
ads = glob.glob("F:/attention flow/flickr/days_with_sink/*")

ti_cum_log = []
di_cum_log = []
Drmax_log = []
Dmax = []
Tmax = []
for i in ads[:182]:
    print i
    # i = 'F:/attention flow/flickr/days_with_sink/2004-09-22'
    g=constructFlowNetwork(i)
    h=flowBalancing(g)
    try:
        tcl, dcl, Dl, Dm, Tm = prepocessingData(h)
    except:
        print 'error:', i
        pass
    ti_cum_log.extend(tcl)
    di_cum_log.extend(dcl)
    Drmax_log.extend(Dl)
    Dmax.extend([Dm])
    Tmax.extend([Tm])

a, b = sizeAdjustedFit(ti_cum_log, di_cum_log, Drmax_log)
Dmax_mean = mean(Dmax)
Tmax_mean = mean(Tmax)
print a, b, Dmax_mean, Tmax_mean
#0.761353942389 0.16262142387 98.0934065934 437.972527473
Yelp Review
数据源
从这里可以下载Pheonix地区一万五千商家一年内评论数据,大约300M,包括7万用户。时间从2005年2月到2014年1月。
数据预处理
import os
os.chdir("F:/attention flow/yelp/")

business = open("./yelp_phoenix_academic_business.txt"  ,'wb')
review = open("./yelp_phoenix_academic_review.txt"  ,'wb')
checkin = open("./yelp_phoenix_academic_checkin.txt"  ,'wb')
tip = open("./yelp_phoenix_academic_tip.txt", 'wb')
user = open("./yelp_phoenix_academic_user.txt", 'wb')

with open('./yelp_phoenix_academic_dataset.json') as f:
    for line in f:
        line = line.strip('\n')
        if line[:6] == '{"busi':
            print >> business,"%s"%(line)
        elif line[:6] == '{"vote':
            print >> review, "%s"%(line)
        elif line[:6] == '{"chec':
            print >> checkin, "%s"%(line)
        elif line[:6] == '{"user':
            print >>tip, "%s"%(line)
        elif line[:6] == '{"yelp':
            print >>user, "%s"%(line)
        else:
            pass

business.close()
review.close()
checkin.close()
tip.close()
user.close()

# sort by date and user first:from past to now
data = []
with open('./yelp_phoenix_academic_review.txt') as f:
    for line in f:
        line = line.split('": "')
        user = line[1].split('"')[0]
        business = line[6].split('"')[0]
        date = line[3].split('"')[0]
        data.append((date, user, business))

data = np.array(data)
ind=np.lexsort((data[:,0],data[:,1]))
data = data[ind]

# contruct a dictionary to include monthly datesets
E = defaultdict(lambda:[])
for i in data:
    date = i[0][:7] # one month as a session, format: 2014-01
    try:
        date,user,business = map(lambda x:x, [date, i[1], i[2]])
        #date = datetime.fromtimestamp(time).strftime('%Y-%m-%d')
        E[date].append([user,business])
    except:
        pass

len(E.keys())
len(E.values())

#sort users
F={}
for i in sorted(E)[10:]: # from 2006-01
    print len(E[i])
    F[i]=sorted(E[i],key=lambda x:x[0])
异速增长
耗散
#mean and std of eta
np.mean(etas),np.std(etas) = 0.46, 0.27
size-adjusted fit
print a, b, Dmax_mean, Tmax_mean
-0.311753490545 1.08939962983 1590.43877551 5008.37755102
Yelp tip
数据来源
同Yelp review数据,数据提取方法也相同;数据预处理方式略有不同。
数据预处理
# sort by date and user first:from past to now
data = []
with open('./yelp_phoenix_academic_review.txt') as f:
    for line in f:
        line = line.split('": "')
        user = line[1].split('"')[0]
        business = line[3].split('"')[0]
        date = line[4].split('"')[0]
        data.append((date, user, business))

data = np.array(data)
ind=np.lexsort((data[:,0],data[:,1]))
data = data[ind]

# contruct a dictionary to include monthly datesets
E = defaultdict(lambda:[])
for i in data:
    date = i[0][:7] # one month as a session, format: 2014-01
    try:
        date,user,business = map(lambda x:x, [date, i[1], i[2]])
        #date = datetime.fromtimestamp(time).strftime('%Y-%m-%d')
        E[date].append([user,business])
    except:
        pass

len(E.keys())
len(E.values())

#sort users
F={}
for i in sorted(E)[10:]: # from 2006-01
    print len(E[i])
    F[i]=sorted(E[i],key=lambda x:x[0])
异速增长
耗散
#mean and std of eta
np.mean(etas),np.std(etas) = 0.32, 0.28
size-adjusted fit
print a, b, Dmax_mean, Tmax_mean
-0.10751153015 1.01830004171 799.152542373 2731.22033898
Digg
数据源
从这里可以下载Digg一个月内用户对新闻故事的投票 ,大约86M,包括14万用户对3553条新闻的3,018,197个投票行为。
数据预处理
    from datetime import datetime
    from collections import defaultdict

    # read file using python in IOS system
    with open ('/Users/csid/Documents/bigdata/digg_votes1.csv') as f:
        t =  f.readlines()
    lines = t[0].split('\r')

    # contruct a dictionary to include daily datesets
    E = defaultdict(lambda:[])
    for line in lines:
        try:
            time,user,news = map(lambda x:int(x.strip('\"')), line.strip().split(','))
            date = datetime.fromtimestamp(time).strftime('%Y-%m-%d')
            E[date].append([user,news])
        except:
            pass

    #sort users
    F={}
    for i in E:
        F[i]=sorted(E[i],key=lambda x:x[0])
异速增长
    # get uv and pv
    up=[]
    for i in F:
        d = F[i]
        pv=len(d)
        uv=len(np.unique([j[0] for j in d]))
        up.append([uv,pv])
    #plot scaling law
    uv,pv=np.array(up).T
    alloRegressPlot(uv,pv,'b','o','UV','PV')
    plt.show()
耗散
    # get di and ti
    D={}
    for i in F:
        d = F[i]
        g=constructFlowNetwork(d)
        h=flowBalancing(g)
        s=networkDissipation(h)
        D[i]=s

    #plot dissipation law
    ti,dia,dib = np.array(D.values()[0]).T
    alloRegressPlot(ti,dia,'g','o',r'$T_i$',r'$D_i$')
    plt.show()

    #fit eta in everyday
    etas=[]
    for i in D:
        ti,dia,dib = np.array(D[i]).T
        eta = alloRegressFit(ti,dia)
        etas.append(eta)

    #mean and std of eta
    np.mean(etas),np.std(etas) = 0.74, 0.15
Size-adjusted Fit
'''
# get flow distance
'''
def toSink(G, i):
        try:
            di = G[i]['sink'].values()[0]
        except:
            di = 0
        return di

def flowDistanceDT(G): #input a balanced nx graph
    R = G.reverse()
    mapping = {'source':'sink','sink':'source'}
    H = nx.relabel_nodes(R,mapping)
    #---------initialize flow distance dict------
    L = dict((i,1) for i in G.nodes())  #FlowDistance
    #---------prepare weighted out-degree dict------
    D = {i: toSink(G, i) for i in G.nodes()} #Di
    T = G.out_degree(weight='weight')        #Ti
    #---------iterate until converge------------
    ls = np.array(L.values())
    delta = len(L)*0.01 + 1
    while delta > len(L)*0.01:
        for i in L:
            l=1
            for m,n in H.edges(i):
                l+=L[n]*H[m][n].values()[0]/float(T[m])
            L[i]=l
        delta = sum(np.abs(np.array(L.values()) - ls))
        ls = np.array(L.values())
    #---------clean the result-------
    del L['sink']
    for i in L:
        L[i]-=1
    L['sink'] = L.pop('source')
    T['sink'] = T.pop('source')
    D['sink'] = D.pop('source')
    return L.values(), D.values(), T.values()

def prepocessingData(G):
    # G = h
    fd, di, ti = flowDistanceDT(G)
    # sort data.frame
    mt = np.array([fd, di, ti]).T
    mts = sorted(mt.tolist(), key = lambda x: x[0])
    fd, di, ti = np.array(mts).T
    # get sum values
    Drmax = sum(di)
    Dmax = sum(di)
    Tmax = sum(ti)
    r_index = [index for index, v in enumerate(fd)]
    di_cum = [ sum(di[:i+1]) for i in r_index]
    # replace zero with a small number
    for k, i in enumerate(di_cum):
        if i==0:
            di_cum[k] = 0.000001
        else:
            pass
    # regression
    ti_cum = [ sum(ti[:i+1]) for i in r_index]
    di_cum_log = log(di_cum)
    ti_cum_log = log(ti_cum)
    Drmax_log = [log(Drmax) for i in range(len(r_index))]
    return ti_cum_log, di_cum_log, Drmax_log, Dmax, Tmax

def sizeAdjustedFit(ti_cum_log, di_cum_log, Drmax_log):
    import statsmodels.api as sm
    x = sm.add_constant(di_cum_log)
    X = np.column_stack((x, Drmax_log))
    model = sm.OLS(ti_cum_log, X)
    res = model.fit()
    b, a = res.params[1:]
    return a, b


ti_cum_log = []
di_cum_log = []
Drmax_log = []
Dmax = []
Tmax = []

for i in F:
    print i
    #i = '2009-07-02'
    d = F[i]
    g=constructFlowNetwork(d)
    h=flowBalancing(g)
    tcl, dcl, Dl, Dm, Tm = prepocessingData(h)
    ti_cum_log.extend(tcl)
    di_cum_log.extend(dcl)
    Drmax_log.extend(Dl)
    Dmax.extend([Dm])
    Tmax.extend([Tm])

a, b = sizeAdjustedFit(ti_cum_log, di_cum_log, Drmax_log)
Dmax_mean = mean(Dmax)
Tmax_mean = mean(Tmax)
a, b, Dmax_mean, Tmax_mean
>>> a, b, Dmax_mean, Tmax_mean
(0.24998010088515579, 0.96559674552262376, 22403.666666666668, 106242.47222222222)
def scatterPlot(xdata,ydata,col,mark,xlab,ylab):
    xx = sm.add_constant(xdata, prepend=True)
    res = sm.OLS(ydata,xx).fit()
    constant=res.params[0];beta=res.params[1]#; r2=res.rsquared
    plt.plot(xdata,ydata,mark,color=col)
    plt.xlabel(xlab);plt.ylabel(ylab)
    minx,maxx=plt.xlim(); miny,maxy=plt.ylim()
    plt.text((maxx-minx)/2,(maxy-miny)/3,np.round(beta,2))
    xs = np.linspace(min(xdata),max(xdata),100)
    plt.plot(xs, constant + xs*beta,color='r',linestyle='-')

fig = plt.figure(figsize=(10, 10),facecolor='white')
plt.subplot(2, 2, 1)
scatterPlot(a, b, 'b', 'o', 'a', 'b')
plt.subplot(2, 2, 2)
scatterPlot(Dmax, Tmax, 'b', 'o', 'Dmax', 'Tmax')
plt.subplot(2, 2, 3)
scatterPlot(log(Dmax), a, 'b', 'o', 'ln(Dmax)', 'a')
plt.subplot(2, 2, 4)
scatterPlot(log(Dmax), b, 'b', 'o', 'ln(Dmax)', 'b')
plt.tight_layout()
fig = plt.gcf()
plt.show()

fig.savefig('abfit.png', dpi = 300)
Indiana大学点击流数据
数据源
本数据是来源于印第安纳大学校园网路由纪录的从2006年9月份到2008年3月份(每个月都有缺失)的点击流数据.全部数据有2T左右. 具体数据信息可以参看:Indiana University Clickstream.
点击流的数据格式如下:
XXXXADreferrer1

host1

path1

XXXXADreferrer2

host2

path2

XXXXADreferrer3

host3

path3

...
其中XXXX表示一个用二进制表示的时间戳, AD为相应的标志位,referrer1,2,3为相应的链入的网站域名,host1,2,3为当前访问的域名,path1,2,3为访问的路径.所以,这个数据集并不包括每个用户的点击流轨迹,而是隐去用户标识的每一次点击.
异速生长律
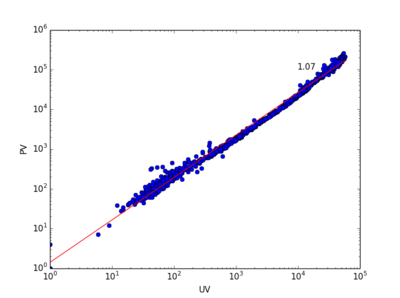
选取2008-01月的数据作为样本,展示每小时的网络在将近一个月(有若干天的数据缺失), 它的异速生长律如下:
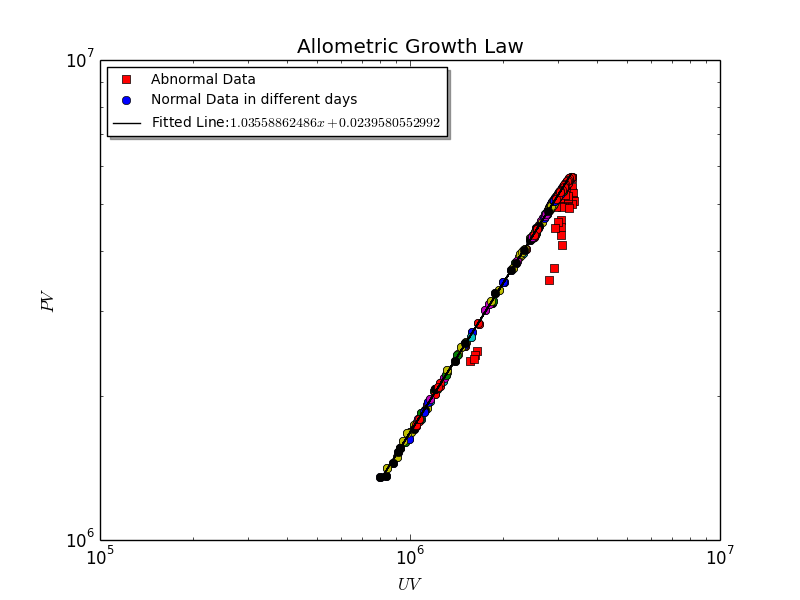
从图中可以看出, PV和UV之间的关系分为了两部分(蓝色和红色). 其中蓝色部分数据为正常数据. 仔细分析红色部分数据会发现,他们都包含了对于某一个网站过多的一次点击行为. 例如abc.com这个网站会多次出现, 入流从空, 不包括耗散的出流却很小. 我们怀疑这是由于某个软件在运作, 不断地访问abc.com这个网站,而不是真正人类的点击行为. 故而,如果一个小时内产生了这样的耗散流与唯一的从源的入流基本上可比拟的时候(出流-入流<-105),那么就把这个小时的数据点标为非正常数据(红色的).
于是,我们仅仅针对正常数据部分计算异速生长律.
耗散律
对于Indiana大学点击流数据的耗散律, 存在这规律比较线性,与理论预期相符.如下图所示(某一小时的点击流耗散律数据)
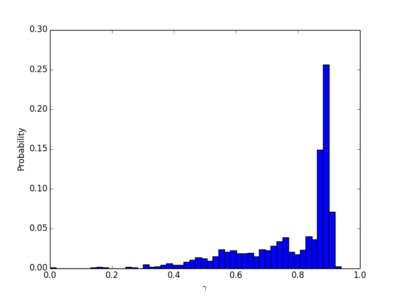
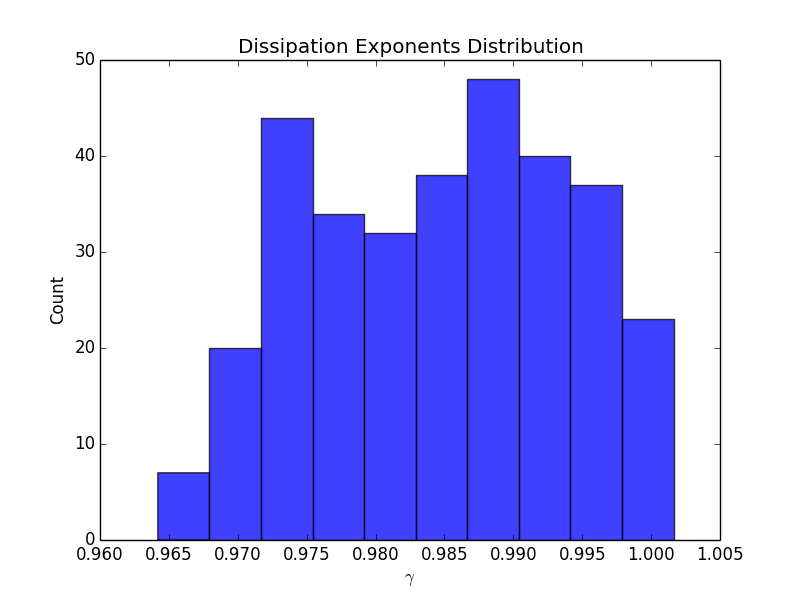
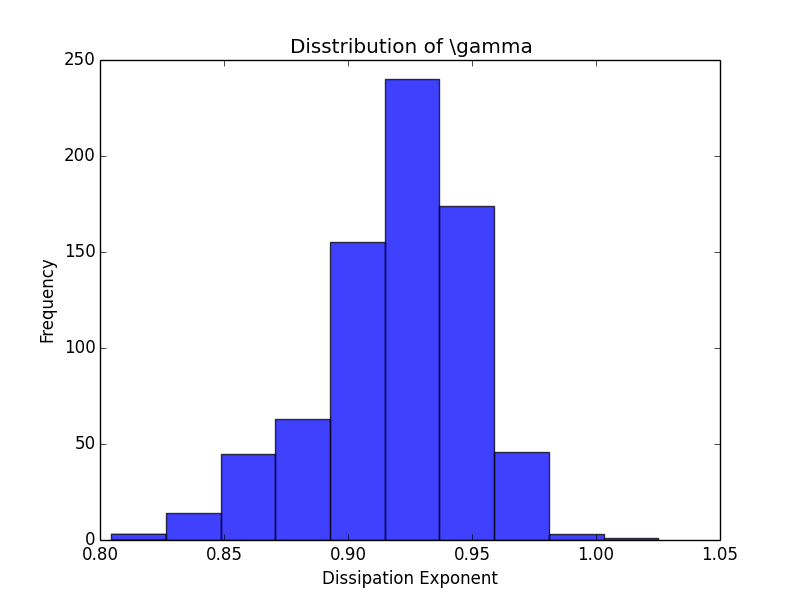
在这种情况下,拟合出来的耗散律指数都非常接近于1. 下面的图展示了2008-01全部小时级点击流网络的耗散律指数的分布情况:
北京移动数据
数据源
由常政提供的数据, 只能用于研究用,不公开.包括了100000个用户一个月内的移动互联网点击流数据. 我们仍然是按照小时做划分, 得到点击流网络
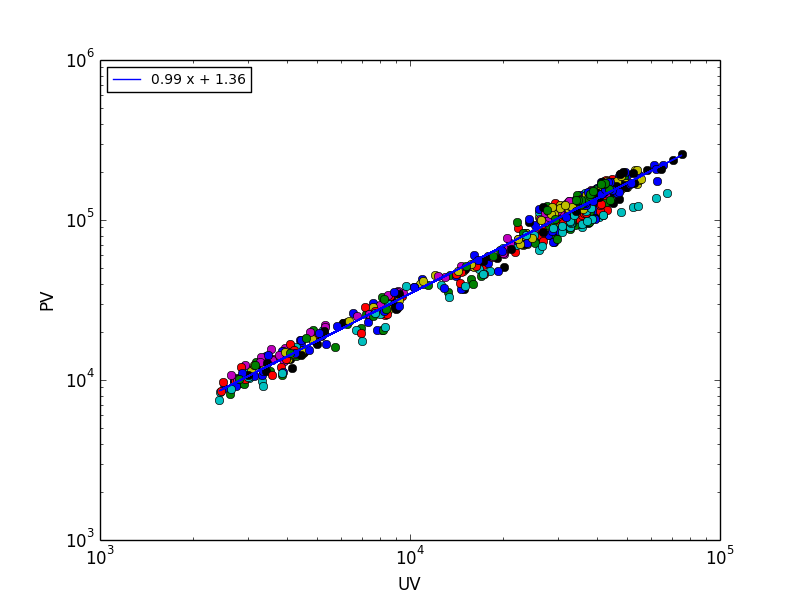
异速生长律
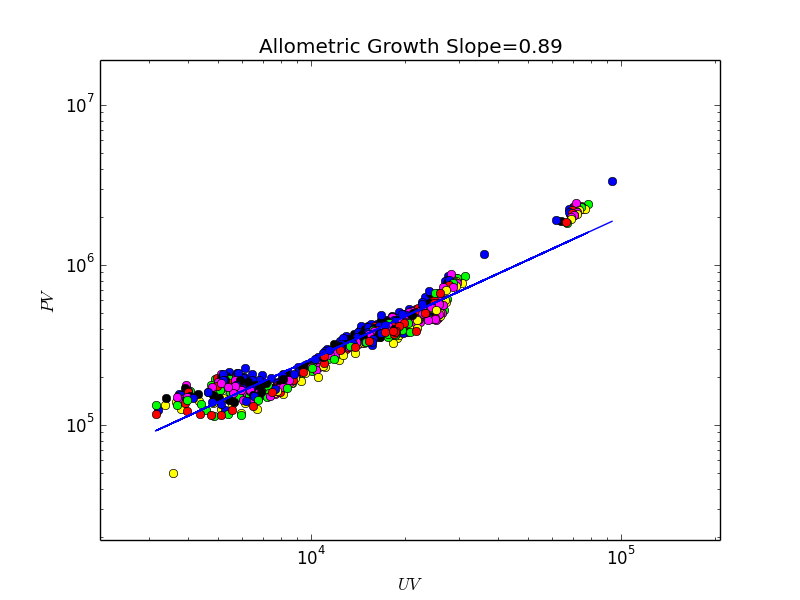
其中,同种颜色的点表示同一天的. 该数据展示了一个亚线性的异速生长律.
耗散律
该图展示了某一天的耗散律情况,规律性不是很强. 耗散指数略小于1.
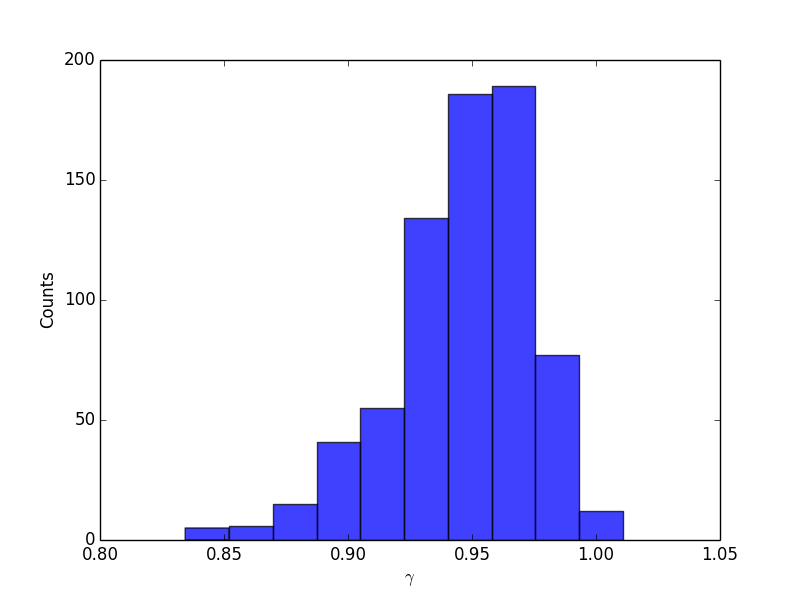
所有小时级网络指数的分布情况
Taobao news
数据源
由chaosTaobao News点击流数据,匿名用户,一个月时间.
异速生长律
该数据的规律性很强,但是幂指数却是1, 说明UV随PV线性增长.
耗散律指数分布
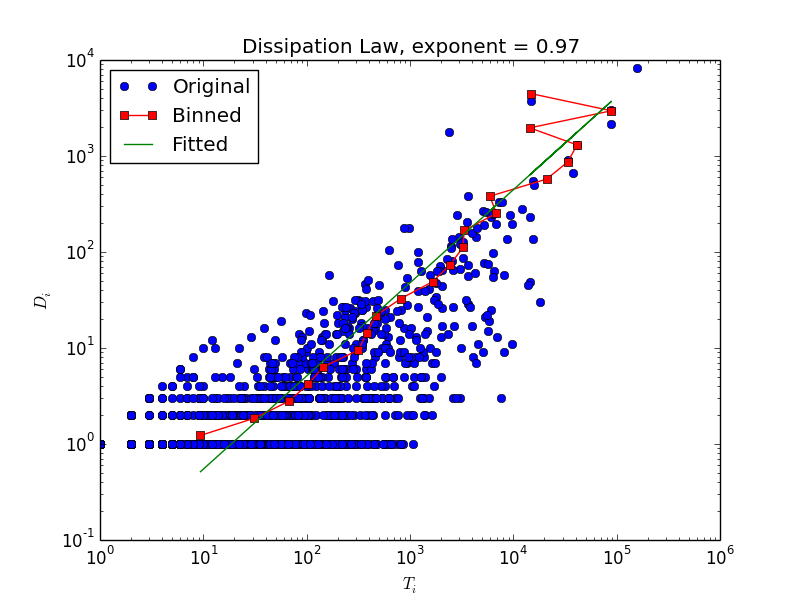
与中国移动的数据类似, 耗散律规律性不强,尤其是在小端. 耗散律指数分布集中在0.97左右
Python代码
OLS回归线拟合画图
    import statsmodels.api as sm
    def OLSRegressFit(x,y):
       xx = sm.add_constant(x, prepend=True)
       res = sm.OLS(y,xx).fit()
       constant, beta = res.params
       r2 = res.rsquared
       return [constant, beta, r2]
双对数坐标系下OLS回归线拟合画图
    import statsmodels.api as sm
    def alloRegressPlot(xdata,ydata,col,mark,xlab,ylab):
        x=np.log(xdata+1);y=np.log(ydata+1);
        xx = sm.add_constant(x, prepend=True)
        res = sm.OLS(y,xx).fit()
        constant=res.params[0];beta=res.params[1]; r2=res.rsquared
        plt.plot(xdata,ydata,mark,color=col)
        plt.xscale('log');plt.yscale('log');plt.xlabel(xlab);plt.ylabel(ylab)
        minx,maxx=plt.xlim(); miny,maxy=plt.ylim()
        plt.text(maxx/10,maxy/10,np.round(beta,2))
        xs = np.linspace(min(xdata),max(xdata),100)
        plt.plot(xs,np.exp(constant)*xs**beta,color='r',linestyle='-')
双对数坐标系下OLS回归线拟合参数估计
    import statsmodels.api as sm
    def alloRegressFit(xdata,ydata):
        x=np.log(xdata+1);y=np.log(ydata+1);
        xx = sm.add_constant(x, prepend=True)
        res = sm.OLS(y,xx).fit()
        constant=res.params[0];beta=res.params[1]; r2=res.rsquared
        return beta
绘制概率分布直方图
    def histogram (data,intervals,color,xlab):
        weights = np.ones_like(data)/len(data)
        plt.hist(data, intervals, facecolor = color, weights=weights, alpha = 0.75)
        plt.xlabel(xlab,size=14)
        plt.ylabel('Probability',size=14)
构建流网络
     import numpy as np
     import matplotlib.pyplot as plt
     import networkx as nx
     from collections import defaultdict

     def constructFlowNetwork (C):
        E=defaultdict(lambda:0)
        E[('source',C[0][1])]+=1
        E[(C[-1][1],'sink')]+=1
        F=zip(C[:-1],C[1:])
        for i in F:
            if i[0][0]==i[1][0]:
                E[(i[0][1],i[1][1])]+=1
            else:
                E[(i[0][1],'sink')]+=1
                E[('source',i[1][1])]+=1
        G=nx.DiGraph()
        for i,j in E.items():
            x,y=i
            G.add_edge(x,y,weight=j)
        return G
对网络进行流平衡
    def flowBalancing(G):
        RG = G.reverse()
        H = G.copy()
        def nodeBalancing(node):
            outw=0
            for i in G.edges(node):
                outw+=G[i[0]][i[1]].values()[0]
            inw=0
            for i in RG.edges(node):
                inw+=RG[i[0]][i[1]].values()[0]
            deltaflow=inw-outw
            if deltaflow > 0:
                H.add_edge(node, "sink",weight=deltaflow)
            elif deltaflow < 0:
                H.add_edge("source", node, weight=abs(deltaflow))
            else:
                pass
        for i in G.nodes():
            nodeBalancing(i)
        if ("source", "source") in H.edges():  H.remove_edge("source", "source")
        if ("sink", "sink") in H.edges(): H.remove_edge("sink", "sink")
        return H
计算从源到所有节点的流距离
    def flowDistanceFromSource(G): #input a balanced nx graph
        R = G.reverse()
        mapping = {'source':'sink','sink':'source'}
        H = nx.relabel_nodes(R,mapping)
        #---------initialize flow distance dict------
        L = dict((i,1) for i in G.nodes())
        #---------prepare weighted out-degree dict------
        T = G.out_degree(weight='weight')
        #---------iterate until converge------------
        ls = np.array(L.values())
        delta = len(L)*0.01 + 1
        while delta > len(L)*0.01:
            for i in L:
                l=1
                for m,n in H.edges(i):
                    l+=L[n]*H[m][n].values()[0]/float(T[m])
                L[i]=l
            delta = sum(np.abs(np.array(L.values()) - ls))
            ls = np.array(L.values())
        #---------clean the result-------
        del L['sink']
        for i in L:
            L[i]-=1
        L['sink'] = L.pop('source')
        return L
测试流距离
    G=nx.DiGraph()
    G.add_edge('source',1,weight=80)
    G.add_edge(1,2,weight=50)
    G.add_edge(1,3,weight=30)
    G.add_edge(3,2,weight=10)
    G.add_edge(2,4,weight=20)
    G.add_edge(2,5,weight=30)
    G.add_edge(4,5,weight=10)
    G.add_edge(5,3,weight=5)
    G.add_edge(2,'sink',weight=10)
    G.add_edge(4,'sink',weight=10)
    G.add_edge(3,'sink',weight=25)
    G.add_edge(5,'sink',weight=35)
    print flowDistanceFromSource(G) # compare it with:
    #zip([1,2,3,4,5,'sink'],[1, 365/164.0, 193/82.0, 529/164.0, 285/82.0, 63/16.0])
线性合并(x轴上每单位计算一次y均值)
    def linearBin(x,y):
        a=[]
        q=sorted(zip(map(int,x),y))
        tag = ''
        d=[]
        for i in q:
            x1,y1 = i
            if x1 == tag:
                d.append(y1)
            else:
                if tag:
                    a.append([tag,np.mean(d)])
                tag = x1
                d = []
        a.append([tag,np.mean(d)])
        nx,ny = np.array(a).T
        return nx,ny
以半径r将节点随机投影在圆环上
    def circle(r):
        radius = r
        angle = random.uniform(0, 2*np.pi)
        return radius*np.sin(angle), radius*np.cos(angle)
获得所有节点的耗散数据
    def networkDissipation(G):
        d=[]
        RG = G.reverse()
        def nodeDissipate(node):
            toSink=0
            outw=0
            for i in G.edges(node):
                outw += G[i[0]][i[1]].values()[0]
                if i[1]=="sink":
                    toSink += G[i[0]][i[1]].values()[0]
            inw=0
            for i in RG.edges(node):
                inw+=RG[i[0]][i[1]].values()[0]
            fromSource=outw-inw
            totalflow=max(inw,outw)
            d.append([totalflow,toSink,fromSource])
        for i in G.nodes():
            if i=="sink":
                continue
            nodeDissipate(i)
        return d
解析字符串日期
    from datetime import datetime

    timestamp = "1322485986"
    t = datetime.fromtimestamp( int(timestamp) )
    d = t.strftime('%Y-%m-%d')
    s="2012-01-01"
    time.mktime(datetime.strptime(s,'%Y-%m-%d').timetuple())
获得连续的天数
    import datetime
    def getDays(year1, month1, day1, year2, month2, day2):
        dt = datetime.datetime(year1, month1, day1)
        end = datetime.datetime(year2, month2, day2)
        step = datetime.timedelta(days=1)
        days = []
        while dt < end:
            days.append(dt.strftime('%Y%m%d'))
            dt += step
        return days

    days = getDays(2013, 2, 27, 2013, 4, 27)
实时打印当前数据处理进度
    def flushprint(s):
        sys.stdout.write('\r')
        sys.stdout.write('%s' % s)
        sys.stdout.flush()
理论分析
鉴于所有的点击流数据中,耗散律规律都不明显,故而考虑新的指标。 假设流系统是典型的Dreyer球,那么我们可以发现实际上流量沿着半径r的累积速度和耗散沿着半径的累积速度决定了异速生长标度律指数。让我们来做一个计算。
设Dreyer球半径为R,空间维数为d。按照Dreyer球假说,半径r处的总流量为:
[math]\displaystyle{ f(r)=V_{d}(R^d-r^d) }[/math]
其中,[math]\displaystyle{ V_d }[/math]为d维空间单位球的体积。
这样,半径r内的总流量为:
[math]\displaystyle{ F(r)=\int_{0}^{r}f(s)ds=V_{d}r(R^d-\frac{1}{d+1}r^d) }[/math]
这便是沿着半径r的累积流量关系式。
另一方面,半径r内的总耗散为:
[math]\displaystyle{ D(r)=V_dr^d }[/math]
这便是耗散沿着半径r的累积规律。这两个累积规律决定了异速生长律。只要我们从上两式消掉r,得到:
[math]\displaystyle{ F=(\frac{D}{V_d})^{1/d}(V_dR^d-\frac{D}{d+1}) }[/math]
根据Dreyer球假说,总入流I等于球的体积,所以,[math]\displaystyle{ I=V_dR^d }[/math],于是:
[math]\displaystyle{ F=I(\frac{D}{V_d})^{1/d}(1-\frac{1}{d+1}\frac{D}{I}) }[/math] (*)
这便是联系了入流,任意半径r处总的耗散,以及任意半径r处总的流量的表达式。当r=R的时候,D=I,于是我们得到:
[math]\displaystyle{ F\sim I^{(d+1)/d} }[/math]
即有异速生长律。另外,当Dreyer球变大,亦即当I变大,我们发现,公式(*)的形式保持不变,这样才导致了最后的异速生长律指数稳定。 因此,公式(*)的形式决定了异速生长指数。那么从(*)中我们如何估计出异速生长指数呢?我们发现,当r很小的时候,D<<I,于是公式(*)约等于:
[math]\displaystyle{ F\sim D^{1/d} }[/math]
也就是说,F会跟D呈现幂律关系,这个幂指数为1/d。如果设这个幂指数为[math]\displaystyle{ \mu }[/math],则异速生长指数[math]\displaystyle{ \theta }[/math]与这个幂指数有如下关系:
[math]\displaystyle{ \mu=\theta-1 }[/math]
这样,假如我们并不知道Dreyer球嵌入在多少维的空间,但是根据某一个网络能估计出[math]\displaystyle{ \mu }[/math]指数,这样我们依然能够估计出生长指数[math]\displaystyle{ \theta }[/math]。
一般流网络
对于一般流网络,它很有可能不是规则的球。但是我们可以计算任意节点的耗散和流量以及营养级。于是,只要我们沿着营养级,将累积的[math]\displaystyle{ T(L_i) }[/math]和累积的[math]\displaystyle{ D(L_i) }[/math],其中Li为i节点的营养级,并得到了近似的sigmod曲线形式。为了与真实数据相符合,同时为了方便我们进行理论分析,我们假设这个Sigmod曲线可以用Gompertz函数拟合(参见http://en.wikipedia.org/wiki/Gompertz_curve),即无论是T还是D可以写成如下的形式:
[math]\displaystyle{ T(L)=T_{max}\exp(-k_T\exp(-c_T L)) }[/math]
[math]\displaystyle{ D(L)=D_{max}\exp(-k_D\exp(-c_D L)) }[/math]
其中kT, cT, kD,cD都是拟合参数,Tmax,Dmax分别是累积T和累积D的最大值,也就是PV和UV。同时,假设
[math]\displaystyle{ c_T\approx c_D }[/math]
在实际数据中,也基本如此。这样,联立T(L)和D(L)的表达式,消去L,我们可以得到:
[math]\displaystyle{ \left(\frac{T}{T_{max}}\right)^{k_D}=\left(\frac{D}{D_{max}}\right)^{k_T} }[/math]
我们再把异速生长律[math]\displaystyle{ T_{max}\sim (D_{max})^{\theta} }[/math]代进去,则得到:
[math]\displaystyle{ T=D^{k_T/k_D}D_{max}^{\theta-k_T/k_D} }[/math]
这与我们的实证观察相符合的。对于某些实证点击流数据来说,有[math]\displaystyle{ k_T/k_D\approx \theta }[/math]于是,[math]\displaystyle{ T\sim D^{k_T/k_D} }[/math]。否则,也有可能不相等,这个时候尺度依赖因子[math]\displaystyle{ D_{max}^{\theta-k_T/k_D} }[/math]将起到关键作用。
继续分析
1. 不需要ti随着li变化的钟型曲线h(l),只使用di随着li变化的钟型曲线g(l):
因为 [math]\displaystyle{ D_l=\int_0^l g(l) }[/math]
则
[math]\displaystyle{ T_l = D_l E(l)=D_l \int_0^l w(l)*l=D_l \int_0^l g(l)*l/D_l =\int_0^l g(l)*l }[/math]
有
[math]\displaystyle{ \frac{dD_l}{dl}=\frac{dT_l}{ldl} }[/math]
两边同时对l积分(右边采取分部积分)
[math]\displaystyle{ D_l +k = T_l(l-l log(l)+\frac{1}{l}) }[/math]
2. 使用DGBD来拟合S形曲线 [math]\displaystyle{ l = A(UV+1-D_l)^b{D_l}^a }[/math]
等价于 [math]\displaystyle{ D_l=\int_0^l g(l) }[/math]
可以绕过钟形曲线g(l)的具体表达?
Indiana大学点击流数据耗散模式分析
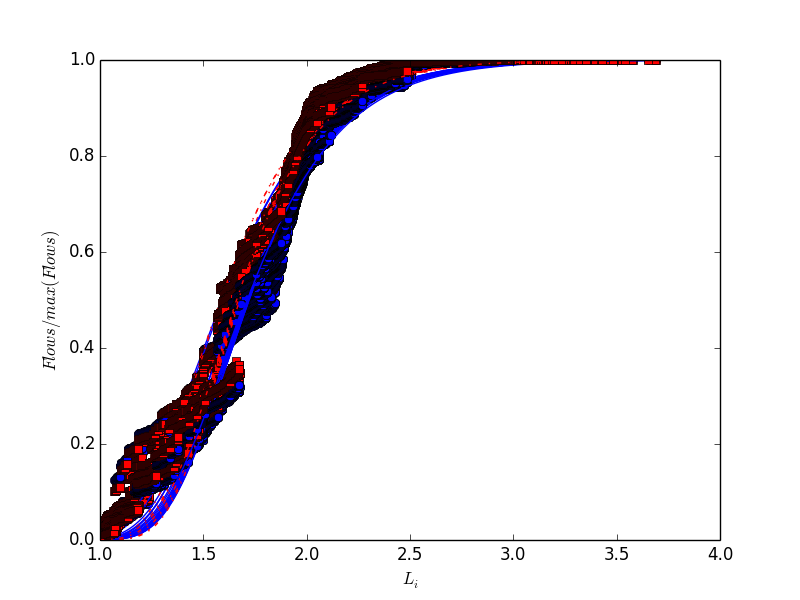
我们用Indiana大学的2006-10-15的点击流数据来进行说明。首先,我们可以用Gompertz函数来拟合T(L)和D(L)。在实践中,我们仅需要利用Scipy.optimization包中的curve_fit函数就可以拟合Gompertz函数。我们将原始数据的纵轴除以Tmax或者Dmax,把24小时的画在一张图上,所有的曲线几乎collapse到一起,如下图
其中,红色曲线为T,蓝色为D,拟合曲线画到了图上,T比D稍偏左。通过Gompertz函数的图形,我们知道参数k控制了曲线的横向平移,于是拟合得到的kT比kD略小,从而使得[math]\displaystyle{ k_T/k_D }[/math]略大于1.这与我们观察到的耗散模式相符,如下图:
我们看到,对于Indiana的该数据集,耗散模式与异速生长律指数相符得非常好,都是接近于1。而仔细研究每一个小时耗散模式的幂律拟合,可以得到分布:
我们看到耗散模式幂指数略大于1,与观测到的kD略大相符合。
数据分析
百度贴吧帖子之间的点击流
我们分析了lol这个排名前十的贴吧在某一天内的24各小时级点击流网络。
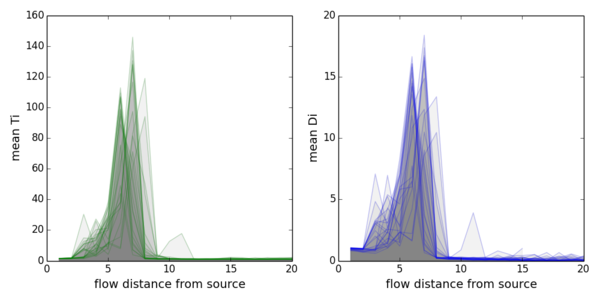
上图展示了节点(帖子)的Di和Ti随到源流长度的变化。因为原始数据噪音比较大,这里使用了linear-bin,即对每一步长,取Di和Ti的平均值。在两幅图中,每一条曲线代表一个小时,一共24小时。可以看出,帖子点击流网络的特征是,耗散随着到源的距离渐渐增加,在6步左右时突然增加,到9步之后基本不再耗散。我们观察发现,虽然网络中离源最远的节点可以达到六七十步,但大多数节点离源的距离都在十步以内。另外一个值得注意的是24条曲线的形状基本上是相似的。说明这24个流网络的结构是相似的。
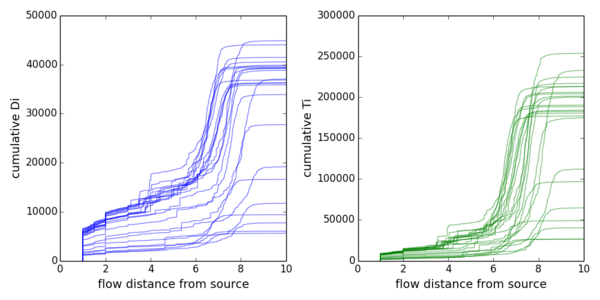
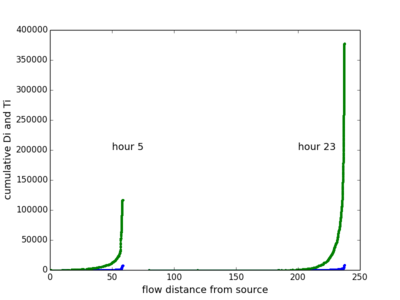
上图展示了节点(帖子)的累计Di和Ti随到源流长度的变化。累计的好处是不需要计算均值,曲线仍然是光滑的。此时24条曲线的相似性体现得更加明显了。
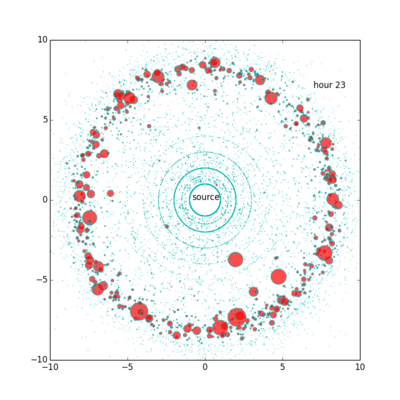
接下来,我们考虑利用流距离来展示网络。一般来说,贴吧在第5小时总流量最小,第23小时小时总流量最大,本贴吧也不例外。因此我们只展示这两个小时的网络。
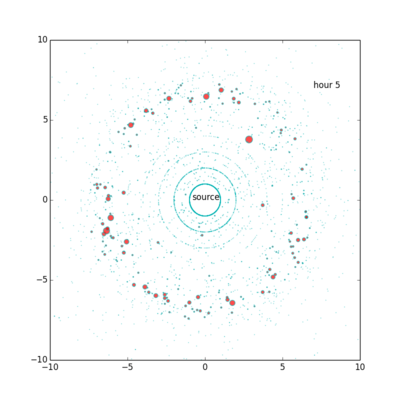
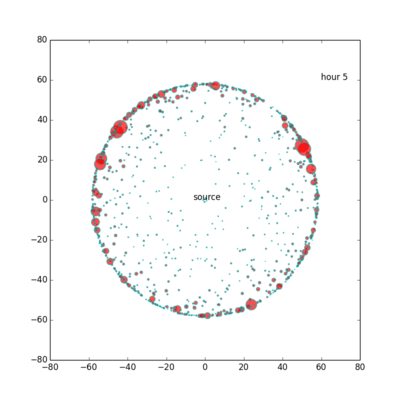
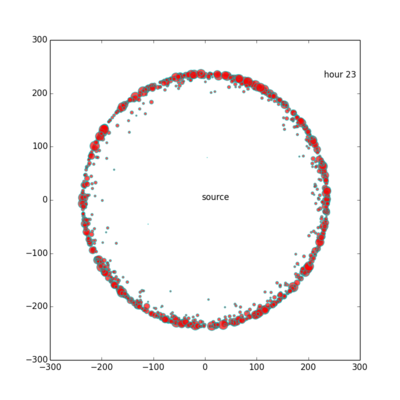
上图展示了第5个小时的点击流网络。其中每个圆圈都是帖子,其面积与Ti成正比,到中心的距离与流距离成正比,角度为随机选择。从这个图里,可以直观地看出耗散随流距离变化“先变大后边小”的规律。我们直观地看到,比较大流量的节点基本上位于离源不远不近的同一层中。本图一共有约15,000个节点。
上图展示了第23个小时的点击流网络。结构与第5个小时的点击流网络类似,但节点更多更密集,大节点面积也更大一些。本图一共有约95,000个节点。
百度贴吧帖子之间的点击流新分析(07-29)
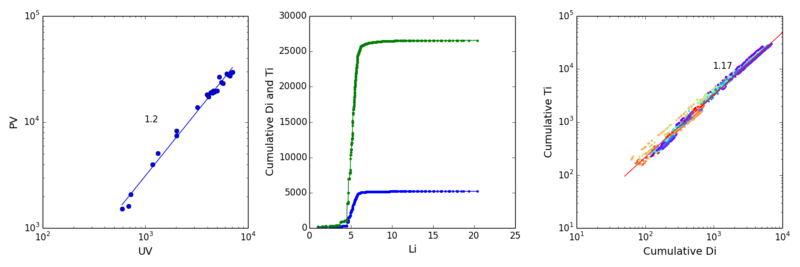
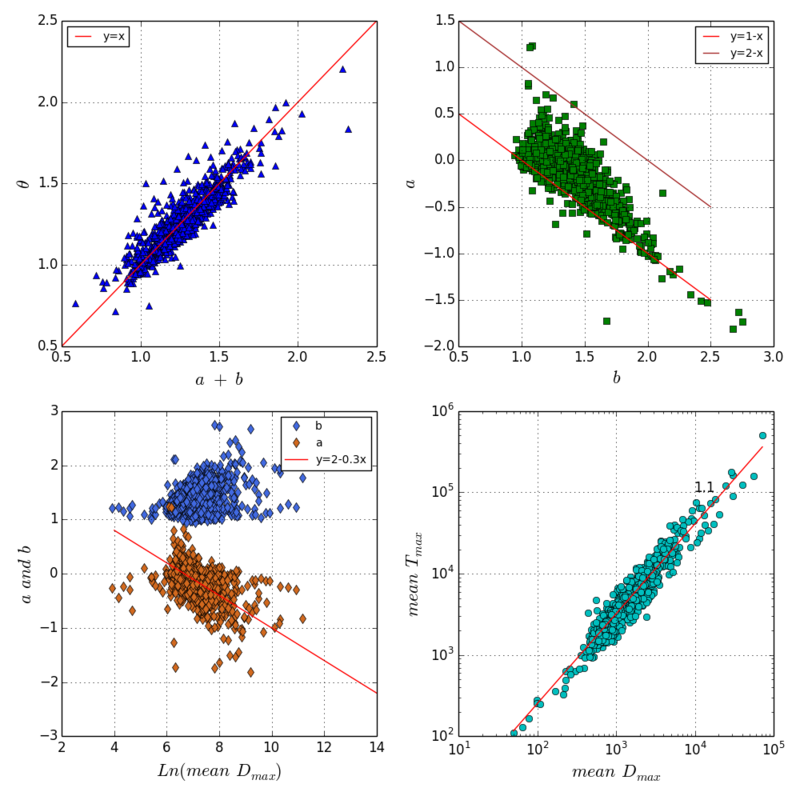
左图展示了EXO吧在24小时内uv和pv的scaling 关系及拟合的theta;中图展示了第23小时di(蓝色)和ti(绿色)随Li的累积。右图展示了24条累计di和累计ti的关系,我们逐一拟合后取均值(图中红线)mu,发现这个数值很接近theta。
实际上,我们如果把不同时间的贴吧流网络看做是一个大小变化但自相似的球,且注意到对di和ti在li=max(li)处的积分即uv和pv,那似乎有理由根据这个球内部的流层级结构来推测这个球的生长。也就是说,一个小时内的di和ti随li变化告诉我们一个“假想球”和流量和存量如何随着体积(半径)变化,而我们认为不同小时内的流量和存量随球体积(半径)的真实变化与该“假想球”的变化趋势是一致的。所以mu应该等于theta
类似于上图的结果,本数据为superjunior吧。
类似于上图的结果,一个bad case,本数据为lol吧。
类似于上图的结果,一个bad case,本数据为les吧。
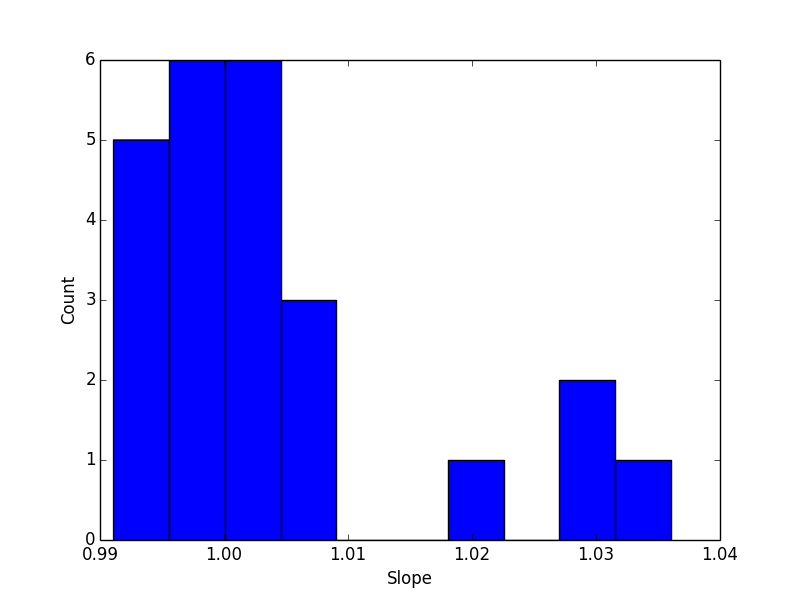
我们发现,mu与theta相差比较大的吧,往往是双对数下不同小时的累积Ti vs累积Di数据点没有重叠在一起,而是通过平移组成一个平行四边形。也就是说,每个小时回归线的截距是不一样的。通过这个启发,我们在实际拟合中,对于每个贴吧,不仅记录theta的值, 以及mu的24小时均值,而且还记录拟合mu时平均截距的大小。对所有的1000个吧画出下图:
其中颜色代表双对数系下拟合mu时平均截距的大小。我们发现,数据点围绕y=x对称,因此,我们的猜想mu等于theta得到了支持。
百度贴吧帖子之间的点击流新分析(08-11)
时间过得真快。一转眼十来天就过去了。上次的结果还不错,发现theta与mu之间的关系。但是发现有很大的噪音,而这个噪音与贴吧本身的规模有关系。于是在我们上次电话讨论中,决定考虑一个size-addjusted的scaling关系
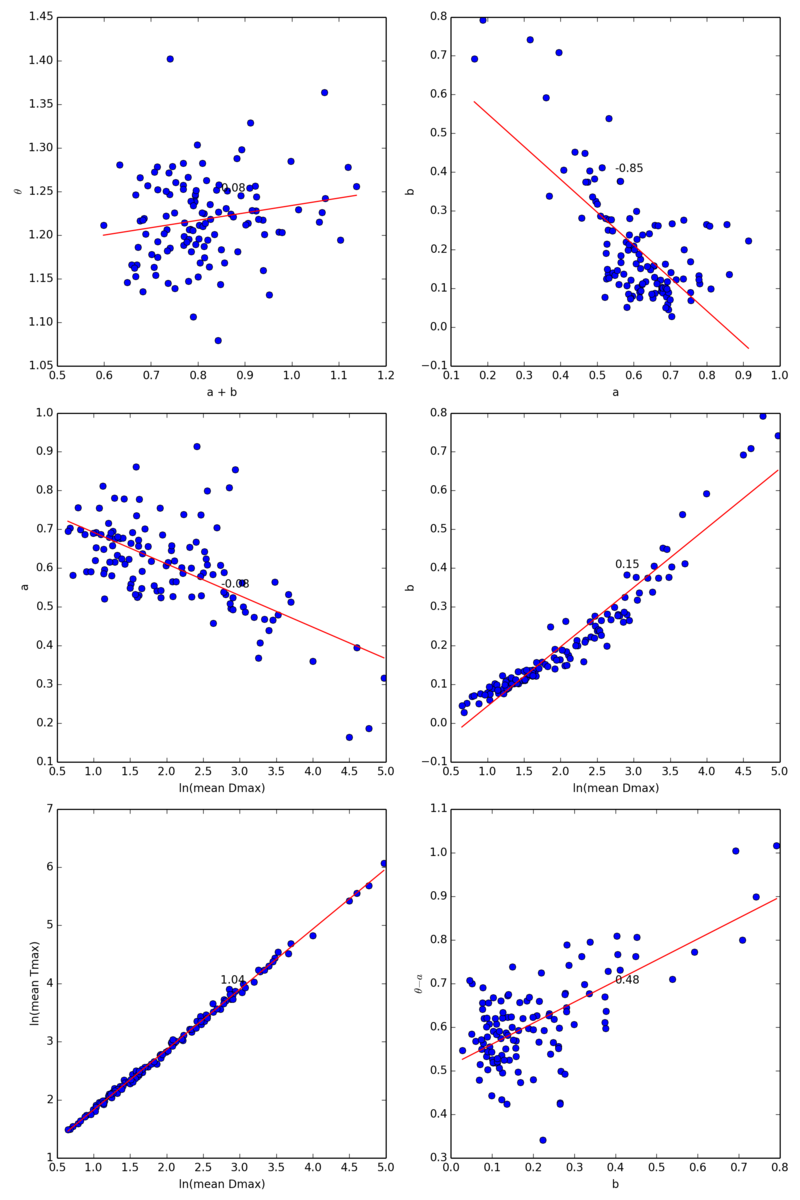
[math]\displaystyle{ T(r) = A*D_{rmax}^aD(r)^b }[/math]
其中T(r)和D(r)代表沿半径r从source到sink对节点的直接流通量ti和耗散量di进行积分。当r=rmax时,D(r)=D(rmax)=UV。
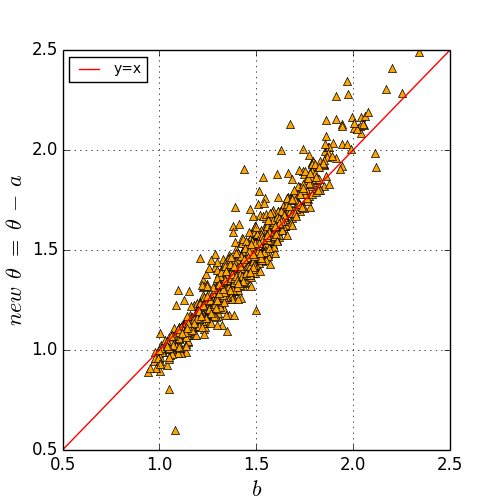
实证发现,这个猜想是成立的。令我们对异速增长的理解又推进了一部。这里的b其实就是之前分析的mu,而a是一个新的,仅仅取决于size的,对任意一个百度贴吧都成立的普适参数。我们认为,异速增长theta的大小主要取决于b,同时受到系统规模的干扰来产生噪音a。换言之,使用b来预测size-addjusted的theta'=theta-a是非常准确的。
百度贴吧之间的点击流
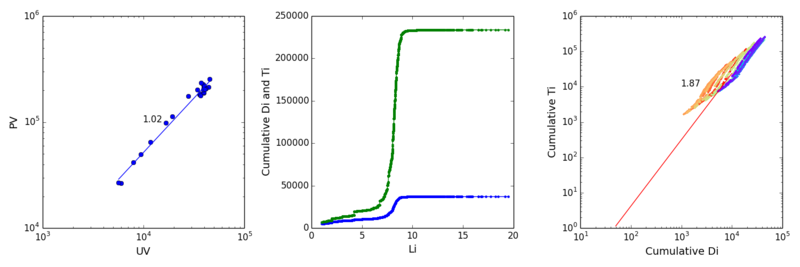
为了与上一节比较,我们分析了排名前1000的百度贴吧构成的小时级点击流网络。因为数据量较大,我们暂时只分析第5小时和第23小时的网络。
上图展示了第5个小时和第23个小时,节点(贴吧)的累计Di和Ti随到源流长度的变化。可以看出,曲线分布十分类似。与贴吧内部的帖子之间的点击流不同,这里的趋势是耗散随着�流距离增加极其缓慢,直到某一个临界值突然大幅增加。我们猜测这是因为我们只选取了排名前1000的贴吧的关系。如果我们选择10,000或者更大量级,应当也会出现类似于贴吧内点击流网络的先上升后不变的趋势。
上图展示了第5个小时的点击流网络。从这个图里,可以直观地看出耗散随流距离变化“先不变后突然变大“的趋势。
上图展示了第23个小时的点击流网络。结构与第5个小时的点击流网络类似,但节点大节点面积也更大一些。
北京移动用户点击流和迁移流
以第一天为例,以每一个小时作为分析单位,构建点击流网络和迁移网络。
#construct 24 edge dictionaries
def clickStream(V):
    E={}
    for i in range(24):
        E[i]=defaultdict(lambda:0)
    # fill user clickstrems into empty graphs
    for u in V:
        record = V[u]
        # conver user:(time,longitude_latitude, site) to user:(hour, non-repeated site)
        stream=defaultdict(lambda:[])
        for i in record:
            hour=int(str(i[0])[8:10])
            site=i[2]
            stream[hour].append(site)
        for h in stream:
            l = stream[h]
            nl = [(x,y) for x,y in zip(l[:-1],l[1:]) if x!=y]
            if nl:
                for e in nl:
                    E[h][e]+=1 # it would be flow balanced later!
            else:
                a=l[0]
                E[h][('source',a)]+=1
                E[h][(a,'sink')]+=1
    return E

def mobilityStream(V):
    E={}
    for i in range(24):
        E[i]=defaultdict(lambda:0)
    # fill user clickstrems into empty graphs
    for u in V:
        record = V[u]
        # conver user:(time,longitude_latitude, site) to user:(hour, non-repeated site)
        stream=defaultdict(lambda:[])
        for i in record:
            hour=int(str(i[0])[8:10])
            site=i[1]
            stream[hour].append(site)
        for h in stream:
            l = stream[h]
            nl = [(x,y) for x,y in zip(l[:-1],l[1:]) if x!=y]
            if nl:
                for e in nl:
                    E[h][e]+=1
            else:
                a=l[0]
                E[h][('source',a)]+=1
                E[h][(a,'sink')]+=1
    return E

cs = clickStream(V)
ms = mobilityStream(V)
def saveData(f, fName):
     for i in f.keys():
         path = 'D:/chengjun/China Mobile Internet/'
         file_save = path + fName +'/'+ str(i)
         if not os.path.exists(path + fName):
             os.makedirs(path + fName)
         with open(file_save, 'a') as g:
             for k, v in f[i].items():
                 try:
                     g.write(str(k[0]) +'\t' + str(k[1]) + '\t' + str(v) +'\n')
                 except:
                     print k, v


saveData(cs, 'clickstream')
saveData(ms, 'mobilitystream')
可视化实验
Digg注意力球
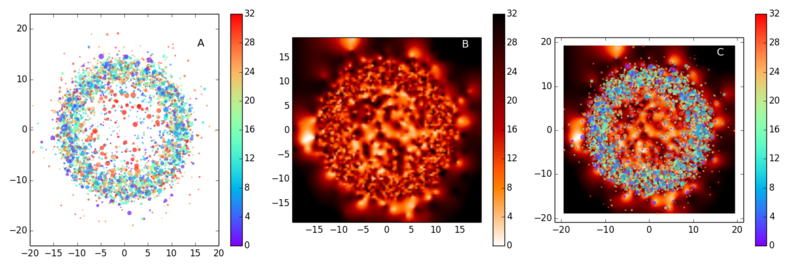
上图展示了使用Digg数据画的attention ball。每一个节点代表一个新闻。一共3552个节点。基本思想是使用流距离Li作为到圆心的r,随机选择方向生成圆上的x,y点,然后使用新闻的年龄(天)作为z来画点的颜色(A),或者密度(B),一共32天数据。因为在Digg数据中,用户一般是先看比较近期的新闻,然后看比较以前的新闻,所以年龄与流距离有关系。A中节点的大小与流量Ti成正比,B中使用了heat的color scheme和密度插值方法。C则是简单地把A和B重叠在一起。
实验代码
    D={}
    with open ('/Users/csid/Documents/research/hiddenAttentionGeometry/data/diggBallData') as f:
        for line in f:
            line = map(float,line.strip().split('\t'))
            D[line[0]]=line[1:]
    x,y,s,z=np.array(D.values()).T
    import scipy.interpolate
    def densityPlot(x,y,z,s,add):
        # Set up a regular grid of interpolation points
        xi, yi = np.linspace(x.min(), x.max(), 100), np.linspace(y.min(), y.max(), 100)
        xi, yi = np.meshgrid(xi, yi)
        # Interpolate
        rbf = scipy.interpolate.Rbf(x, y, z, function='linear')
        zi = rbf(xi, yi)
        plt.imshow(zi, vmin=z.min(), vmax=z.max(), origin='lower',cmap = plt.get_cmap('gist_heat_r'),
                   extent=[x.min(), x.max(), y.min(), y.max()])
        if add==True:
            plt.scatter(x, y, c= z,s=s, cmap=cm.get_cmap('rainbow',len(z)),edgecolors='none',alpha=0.7)
        plt.colorbar()
        #plt.show()
    fig = plt.figure(figsize=(15, 5),facecolor='white')
    #
    ax = fig.add_subplot(131)
    plt.scatter(x, y, c= z,s=s/50, cmap=cm.get_cmap('rainbow',len(z)),edgecolors='none',alpha=0.7)
    plt.colorbar()
    plt.xlim(-20,20)
    plt.ylim(-23,23)
    plt.text(15.5,16.5,'A',size=14)
    #
    ax = fig.add_subplot(132)
    densityPlot(x,y,z,s,False)
    plt.text(15.5,17,'B',size=14,color='w')
    #
    ax = fig.add_subplot(133)
    densityPlot(x,y,z,s/50,True)
    plt.text(15.5,17,'C',size=14,color='w')
    plt.tight_layout()
    plt.show()
Exo流网络
    # read baidu exo data
    bar='exo'
    D=defaultdict(lambda:[])#24 networks
    with open('/Users/csid/Documents/bigdata/tiebadailynetwork/20130228/'+bar,'rb') as f:
        for line in f:
            hour,a,b = line.strip().split("\t")
            hour=int(hour)
            D[hour].append([a,b])

    def flowBalancing(G):
        RG = G.reverse()
        H = G.copy()
        def nodeBalancing(node):
            outw=0
            for i in G.edges(node):
                outw+=G[i[0]][i[1]].values()[0]
            inw=0
            for i in RG.edges(node):
                inw+=RG[i[0]][i[1]].values()[0]
            deltaflow=inw-outw
            if deltaflow > 0:
                H.add_edge(node, "sink",weight=deltaflow)
            elif deltaflow < 0:
                H.add_edge("source", node, weight=abs(deltaflow))
            else:
                pass
        for i in G.nodes():
            nodeBalancing(i)
        if ("source", "source") in H.edges():  H.remove_edge("source", "source")
        if ("sink", "sink") in H.edges(): H.remove_edge("sink", "sink")
        return H

    def flowDistanceFromSource(G): #input a balanced nx graph
        R = G.reverse()
        mapping = {'source':'sink','sink':'source'}
        H = nx.relabel_nodes(R,mapping)
        #---------initialize flow distance dict------
        L = dict((i,1) for i in G.nodes())
        #---------prepare weighted out-degree dict------
        T = G.out_degree(weight='weight')
        #---------iterate until converge------------
        ls = np.array(L.values())
        delta = len(L)*0.001 + 1
        k=0
        while delta > len(L)*0.001:
            k+=1
            if k>20:
                break
            for i in L:
                l=1
                for m,n in H.edges(i):
                    l+=L[n]*H[m][n].values()[0]/float(T[m])
                L[i]=l
            delta = sum(np.abs(np.array(L.values()) - ls))
            ls = np.array(L.values())
        #---------clean the result-------
        del L['sink']
        for i in L:
            L[i]-=1
        L['sink'] = L.pop('source')
        L['source'] = 0
        return L

    def flowDistanceToSink(G): #input a balanced nx graph
        #---------initialize flow distance dict------
        L = dict((i,1) for i in G.nodes())
        #---------prepare weighted out-degree dict------
        T = G.out_degree(weight='weight')
        #---------iterate until converge------------
        ls = np.array(L.values())
        delta = len(L)*0.001 + 1
        k=0
        while delta > len(L)*0.001:
            k+=1
            if k>20:
                break
            for i in L:
                l=1
                for m,n in G.edges(i):
                    l+=L[n]*G[m][n].values()[0]/float(T[m])
                L[i]=l
            delta = sum(np.abs(np.array(L.values()) - ls))
            ls = np.array(L.values())
        for i in L:
            L[i]-=1
        return L


    def cumuNetwork(h):
        E=defaultdict(lambda:0)
        for i in range(h):
            d = D[i]
            for x,y in d:
                E[(x,y)]+=1
        G=nx.DiGraph()
        for i in E:
            x,y=i
            if y=='s':
                y='sink'
            w=E[i]
            G.add_edge(x,y,weight=w)
        H = flowBalancing(G)
        return H

    G = cumuNetwork(24)
    O = flowDistanceFromSource(G2)
    K = flowDistanceToSink(G2)
    T = G2.out_degree(weight='weight')

    # orbit plot

    xlim=8
    ylim=10

    h=max(K['source'],O['sink'])
    W={}
    for i in G.nodes():
        if i in O and i in K:
            a = O[i]
            b = K[i]
            if a==1 and b==1:
                W[i]=[h/2,0]
            else:
                dx = (h**2-b**2+a**2)/(2*h)
                if a**2-dx**2 >= 0:
                    dy = np.sqrt(a**2-dx**2)
                    W[i]=[dx,dy]
    for i in W:
        W[i][0]-=h/2
    W['source']=[-h/2,0]
    W['sink']=[h/2,0]
    fig = plt.figure(figsize=(8, 8))
    i,j  = np.array(W.values()).T
    plt.scatter(i,j,facecolor='purple',edgecolor='None',s=5,alpha=0.5,zorder=2)
    for i,j in G.edges():
        if i in W and j in W:
            x0,y0 = W[i]
            x1,y1 = W[j]
            if i=='source':
                plt.plot([x0,x1],[y0,y1],linestyle='-',marker='',color='c',alpha=0.02,zorder=1)
            elif j=='sink':
                plt.plot([x0,x1],[y0,y1],linestyle='-',marker='',color='r',alpha=0.02,zorder=1)
            else:
                plt.plot([x0,x1],[y0,y1],linestyle='-',marker='',color='orange',alpha=0.02,zorder=1)
    plt.plot(-h/2,0,'ro',markersize=3)
    plt.plot(h/2,0,'ro',markersize=3)
    plt.xlim(-xlim,xlim)
    plt.ylim(0,ylim)
    plt.show()
