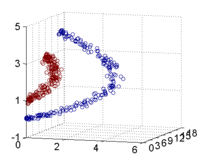
SVM支持向量机
在机器学习中,支持向量机 support vector machine,常简称为SVM,又名支持向量网络[1])指的是一种有监督式学习模型及其相关的学习算法,广泛用于分类及回归分析。当给定一组训练实例,并标记这些训练实例属于两个类别的其中之一,SVM训练算法基于这些实例创建一个模型将新的实例归类为两个类别中的一个,使其成为非概率二元线性分类器(尽管SVM中有些方法如概率输出会在概率分类集合中使用)。SVM模型将实例表示为空间中的点,使得不同类别的实例被尽可能明显的间隔所分开。然后,新的实例将被映射到同一空间中,并基于它们落在间隔的哪一侧来预测其所属类别。
除了进行线性分类之外,SVM还可以使用所谓的核技巧实现有效地非线性分类,将其输入实例映射到高维特征空间中。对于未标记数据,无法进行有监督式学习,但是可以使用非监督式学习进行训练。非监督式学习会尝试找出数据到簇的自然聚类,并将新数据映射到这些已形成的簇中。Hava Siegelmann 和 Vladimir Vapnik创造了支持向量聚类[2]算法,该算法利用支持向量机算法生成的支持向量统计数据对未标记的数据分类。这一算法也成为了工业应用最广泛的聚类算法之一。
动机
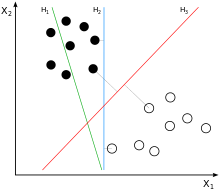
数据分类是机器学习中的一项常见任务。 假设给定的一些数据点各自属于两个类其中之一,而数据分类的目标是利用这些数据确定新给定的数据点将在哪个类中。对于支持向量机来说,数据点被视为[math]\displaystyle{ p }[/math]维向量,而我们想知道是否可以用[math]\displaystyle{ p-1 }[/math]维超平面来分开这些点。这就是所谓的线性分类器。可能存在许多超平面可以把数据分类,而最佳超平面的一个合理选择标准是找出把两个类以最大间隔分开的超平面。
所以,我们要选择的超平面是实现距离超平面最近点之间距离间隔最大的。如果存在这样的超平面,则可将其称为最大间隔超平面,而基于其定义的线性分类器被称为最大间隔分类器,或叫做最佳稳定性感知器。
定义
更正式地来说,支持向量机在高维或无限维空间中构造超平面或超平面集合,其可用于分类、回归或类似异常检测的其他任务[3]。直观来说,分类边界距离最近的训练数据点越远越好,因为这样可以缩小分类器的泛化误差[4]。
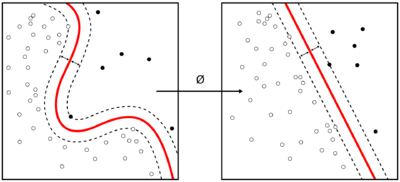
尽管原始问题可能是在有限维空间中陈述的,但用于区分的集合在该空间中往往不是线性可分的。为此,有人提出将原始的限维空间映射到维数高得多的空间中,在这种空间中进行分离可能会更容易。为了保证计算负荷合理,人们选择适合该问题的核函数 k(x,y) 来定义SVM方案使用的映射[5],以确保用原始空间中的变量可以很容易计算点积。高维空间中的超平面指的是与该空间中的某向量的点积是常数的点的集合。定义超平面的向量可以被选择成为在数据集合中出现的特征向量[math]\displaystyle{ x_i }[/math]的图像的参数 [math]\displaystyle{ \alpha _i }[/math]的线性组合。通过选择超平面,被映射到超平面上的特征空间中的点集 [math]\displaystyle{ x }[/math] 由以下关系定义:[math]\displaystyle{ \sum_i\alpha _ik(x_i,x)=constant }[/math]. 需要注意的是,如果随着[math]\displaystyle{ y }[/math] 逐渐远离 [math]\displaystyle{ x }[/math], [math]\displaystyle{ {k}(x,y) }[/math]变小,则求和中的每一项都是在衡量测试点 [math]\displaystyle{ x }[/math]与对应的数据集中点 [math]\displaystyle{ x_i }[/math]的接近程度。在这种情况下,上述内核的总和可以用于衡量每个测试点相对于待分离的集合中的数据点的相对接近度。也要注意到,点[math]\displaystyle{ x }[/math]的集合映射到任何超平面的结果可以特别复杂,同时也允许复杂得多的在原始空间里为非凸集合间的分离。
应用
SVM可以用于解决多种真实世界的问题:
- 用于文本和超文本的分类,在归纳和转导方法中都可以显著减少所需要的有类标的样本数。
- 用于图像分类。实验结果显示:相比于传统的查询优化方案,在经过三到四轮相关反馈之后,支持向量机能够获取明显更高的搜索准确度。这同样也适用于图像分区系统,比如使用Vapnik所建议用特权方法的修改版本SVM的那些图像分区系统。[6][7]
- 用于手写字体识别。[8]
- SVM算法已被广泛应用于生物和其他科学。SVM用于分类蛋白质,可达到90%以上分类准确度。基于支持向量机权重的置换测试可作为一种机制,用于解释的支持向量机模型。[9][10] 在早些时候,支持向量机权重也被用来解释SVM模型。[11]在生命科学领域,利用支持向量机的Posthoc Posthoc interpretation进行特征识别,并用于预测是一个相对较新的研究方向,而且有着特殊的意义。
历史
最初的SVM算法是Vladimir N. Vapnik和Alexey Ya. Chervonenkis 于1963年发明。1992年,Bernhard E. Boser、Isabelle M. Guyon和Vladimir N. Vapnik提出了一种通过将核技巧应用于最大间隔超平面来创建非线性分类器的方法。[12]现行标准的前身(软间隔)由Corinna Cortes和Vapnik于1993年提出,并于1995年发表。
线性SVM
按照以下形式给出 [math]\displaystyle{ n }[/math] 点测试集:
[math]\displaystyle{ (\overrightarrow{x_{1}},y_{1}),...,(\overrightarrow{x_{n}},y_{n}) }[/math]
其中 [math]\displaystyle{ y_1 }[/math] 是 1 或者 −1,表明点 [math]\displaystyle{ \overrightarrow{x_i} }[/math] 所属的类。 [math]\displaystyle{ \overrightarrow{x_i} }[/math]中每个都是一个 [math]\displaystyle{ p }[/math] 维实向量。我们希望找出可将 [math]\displaystyle{ y_i=1 }[/math]的点集[math]\displaystyle{ \overrightarrow{x_i} }[/math] 与 [math]\displaystyle{ y_i=-1 }[/math]的点集分开的 “最大间隔超平面”,使得超平面与最近的点[math]\displaystyle{ \overrightarrow{x_i} }[/math] 之间的距离最大化。
任何超平面都可以表示为满足下面方程的点集 [math]\displaystyle{ \overrightarrow{x_i} }[/math]
[math]\displaystyle{ \overrightarrow{\omega }\cdot \overrightarrow{x}-b=0 }[/math]
其中 [math]\displaystyle{ \overrightarrow{\omega } }[/math](不必是归一化的)是该超平面的法向量,其更像是海赛正规形式,但 [math]\displaystyle{ \overrightarrow{\omega } }[/math]不必是单位向量。参数[math]\displaystyle{ \frac{b}{\left \| \overrightarrow{\omega } \right \|} }[/math]决定了从原点沿法向量[math]\displaystyle{ \overrightarrow{\omega } }[/math]到超平面的偏移量。
硬间隔
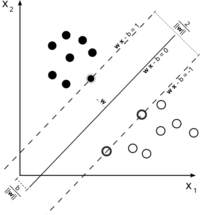
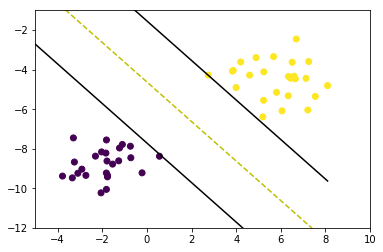
如果这些训练数据是线性可分的,我们可以选择两个平行超平面分离这两类数据,使得它们之间的距离尽可能大。在这两个超平面范围内的区域称为“间隔”,最大间隔超平面是位于它们正中间的超平面。这些超平面可以由以下方程式表示:
- [math]\displaystyle{ \overrightarrow{\omega }\cdot \overrightarrow{x}-b=1 }[/math] (所有位于或者高于这条分界线的属于一类,标签为1)
或是
- [math]\displaystyle{ \overrightarrow{\omega }\cdot \overrightarrow{x}-b=-1 }[/math](所有位于或者低于这条分界线的属于一类,标签为-1)
利用几何方法不难得到这两个超平面之间的距离是[math]\displaystyle{ \frac{2}{\left \| \overrightarrow{\omega } \right \|} }[/math] [13],因此要使两平面间的距离最大,我们需要实现[math]\displaystyle{ \left \| \overrightarrow{\omega } \right \| }[/math]最小化。同时,为了使得样本数据点都在超平面的间隔区以外,我们需要保证对于所有的 [math]\displaystyle{ i }[/math] 满足如下条件之一:
- [math]\displaystyle{ \overrightarrow{\omega }\cdot \overrightarrow{x}-b\gt or= 1 }[/math], 若[math]\displaystyle{ y_i=1 }[/math]
或是:
- [math]\displaystyle{ \overrightarrow{\omega }\cdot \overrightarrow{x}-b\leq 1 }[/math], 若[math]\displaystyle{ y_i=-1 }[/math]
这些限制表明每个数据点都必须位于间隔的正确一侧。
这两个式子也可以写成如下形式:
- [math]\displaystyle{ y_i(\overrightarrow{\omega }\cdot \overrightarrow{x}-b)\geq 1 }[/math], 对所有[math]\displaystyle{ 1\leq i\leq n.\qquad\qquad(1) }[/math]
我们可以结合这个方程式进行问题优化:
“在 [math]\displaystyle{ y_i(\vec{w}\cdot\vec{x_i} - b) \ge 1 }[/math] 条件下,最小化 [math]\displaystyle{ \|\vec{w}\| }[/math],对于 [math]\displaystyle{ i = 1,...,n }[/math]”
这个问题的解 [math]\displaystyle{ \vec w }[/math] 与 [math]\displaystyle{ b }[/math] 决定了我们的分类器 [math]\displaystyle{ \overrightarrow{x} \mapsto sgn(\overrightarrow{\omega }\cdot \overrightarrow{x}-b) }[/math].
这一几何描述的一个显而易见却重要的结果是,最大间隔超平面完全是由最靠近它的那些 [math]\displaystyle{ \overrightarrow{x}_i }[/math] 确定,这些 [math]\displaystyle{ \overrightarrow{x}_i }[/math] 叫做支持向量。
软间隔
为了将SVM扩展到数据线性不可分的情况,我们引入铰链损失函数,
- [math]\displaystyle{ max(0,1-y_{i}(\overrightarrow{\omega }\cdot \overrightarrow{x_{i}}-b)) }[/math].
注意[math]\displaystyle{ y_i }[/math]是第[math]\displaystyle{ i }[/math]个目标(例如,在本例中,1或者-1),[math]\displaystyle{ \overrightarrow{\omega }\cdot \overrightarrow{x_i}-b }[/math]是当前输出。
当约束条件 (1) 满足时(也就是如果 [math]\displaystyle{ \overrightarrow{x}_i }[/math] 位于边距的正确一侧)此函数为零。对于位于间隔的错误一侧的数据,该函数的值与该数据与间隔的距离成正比。
当我们希望其最小化:
[math]\displaystyle{ [\frac{1}{n}\sum_{i=1}^{n}max(0,1-y_i(\overrightarrow{\omega }\cdot \overrightarrow{x_i}-b))]+\lambda \left \| \overrightarrow{\omega } \right \|^{2} }[/math],
其中参数 [math]\displaystyle{ \lambda }[/math] 用来权衡增加间隔大小与确保 [math]\displaystyle{ \overrightarrow{x_i} }[/math] 位于间隔的正确一侧之间的关系。因此,对于足够小的 [math]\displaystyle{ \lambda }[/math] 值,如果输入数据是可以线性分类的,则软间隔SVM与硬间隔SVM将表现相同,但即使数据不可线性分类,仍能学习出可行的分类规则。
非线性分类
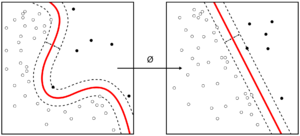
Vapnik在1963年提出的最原始的最大间隔超平面算法构造了一个线性分类器。而1992年,Bernhard E. Boser、Isabelle M. Guyon和Vladimir N. Vapnik提出了一种通过将核技巧(由Aizerman et al.[14]最先提出)应用于最大边界超平面来创建非线性分类器的方法。[12] 除了把点积换成了非线性核函数,所得到的算法形式上与前者类似。这种变化允许算法在变换后的特征空间中拟合最大间隔超平面。这类变换可以是非线性的,但变换空间是高维的;尽管分类器是变换后的特征空间中的超平面,但它在原始输入空间中可以是非线性的。
值得注意的是,更高维的特征空间增加了支持向量机的泛化误差,但是当给定了足够多的样本,算法仍能表现良好。[15]
常见的核函数包括:
- 齐次多项式:[math]\displaystyle{ k(\vec{x_i},\vec{x_j})=(\vec{x_i} \cdot \vec{x_j})^d }[/math]
- 非齐次多项式:[math]\displaystyle{ k(\vec{x_i},\vec{x_j})=(\vec{x_i} \cdot \vec{x_j} + 1)^d }[/math]
- 高斯径向基函数:[math]\displaystyle{ k(\vec{x_i},\vec{x_j})=\exp(-\gamma \|\vec{x_i} - \vec{x_j}\|^2) }[/math],其中 [math]\displaystyle{ \gamma \gt 0 }[/math]。有时参数化表示 [math]\displaystyle{ \gamma=1/{2 \sigma^2} }[/math]
- 双曲正切:[math]\displaystyle{ k(\vec{x_i},\vec{x_j})=\tanh(\kappa \vec{x_i} \cdot \vec{x_j}+c) }[/math],其中一些(而非所有)[math]\displaystyle{ \kappa }[/math]大于0, 且 [math]\displaystyle{ c \lt 0 }[/math]
核函数与经过方程式 [math]\displaystyle{ k(\vec{x_i}, \vec{x_j}) = \varphi(\vec{x_i})\cdot \varphi(\vec{x_j}) }[/math]变换后的 [math]\displaystyle{ \varphi(\vec{x_i}) }[/math] 有关。变换空间中也有 w 值,[math]\displaystyle{ \textstyle\vec{w} = \sum_i \alpha_i y_i \varphi(\vec{x}_i) }[/math]。与 w 的点积也要用核技巧来计算,即 [math]\displaystyle{ \textstyle \vec{w}\cdot\varphi(\vec{x}) = \sum_i \alpha_i y_i k(\vec{x}_i, \vec{x}) }[/math]。
计算SVM分类器
计算(软间隔)SVM分类器等同于求下面表达式的最小解
[math]\displaystyle{ \left[\frac 1 n \sum_{i=1}^n \max\left(0, 1 - y_i(w\cdot x_i + b)\right) \right] + \lambda\lVert w \rVert^2. \qquad(2) }[/math]
如上所述,由于我们关注的是软间隔分类器,[math]\displaystyle{ \lambda }[/math] 选择足够小的值就能得到线性可分类输入数据的硬间隔分类器。下面会详细介绍将(2)简化为二次规划问题的经典方法。之后会讨论一些最近才出现的方法,如次梯度下降法和坐标下降法。
原型
求方程式(2)最小解可用下面的方式改写为目标函数可微的约束优化问题。
对所有 [math]\displaystyle{ i\in \left \{ 1,...,n \right \} }[/math] 我们引入变量 [math]\displaystyle{ \zeta_i = \max\left(0, 1 - y_i(w\cdot x_i + b)\right) }[/math]。要注意到 [math]\displaystyle{ \zeta_i }[/math] 是满足 [math]\displaystyle{ y_i(w\cdot x_i + b) \geq 1- \zeta_i }[/math] 的最小非负数。
因此,我们可以将问题进行优化叙述如下
[math]\displaystyle{ \text{minimize } \frac 1 n \sum_{i=1}^n \zeta_i + \lambda\|w\|^2 }[/math]
[math]\displaystyle{ \text{subject to } y_i(\omega \cdot x_i-b)\geq 1-\zeta _i \,\text{ and }\zeta_i \geq 0,\text{for all }i. }[/math]
这就叫做原型问题。
对偶型
通过求解上述问题的拉格朗日对偶,得到简化的问题
[math]\displaystyle{ \text{maximize}\,\, f(c_1 \ldots c_n) = \sum_{i=1}^n c_i - \frac 1 2 \sum_{i=1}^n\sum_{j=1}^n y_ic_i(x_i \cdot x_j)y_jc_j, }[/math]
[math]\displaystyle{ \text{subject to } \sum_{i=1}^n c_iy_i = 0,\,\text{and } 0 \leq c_i \leq \frac{1}{2n\lambda}\;\text{for all }i. }[/math]
这就叫做对偶问题。由于对偶最小化问题是受线性约束的 [math]\displaystyle{ c_i }[/math] 的二次函数,所以它可以通过二次规划算法高效地解出。 这里,变量 [math]\displaystyle{ c_i }[/math] 定义为满足
[math]\displaystyle{ \vec w = \sum_{i=1}^n c_iy_i \vec x_i }[/math].
此外,当 [math]\displaystyle{ \vec x_i }[/math] 恰好在间隔的正确一侧时 [math]\displaystyle{ c_i = 0 }[/math],且当 [math]\displaystyle{ \vec x_i }[/math] 位于间隔的边界时 [math]\displaystyle{ 0 \lt c_i \lt (2n\lambda)^{-1} }[/math]。因此,[math]\displaystyle{ \vec w }[/math] 可以写为支持向量的线性组合。 可以通过在间隔的边界上找到一个 [math]\displaystyle{ \vec x_i }[/math] 并求解
[math]\displaystyle{ y_i(\overrightarrow{\omega }\cdot \overrightarrow{x_i}-b)=1\Leftrightarrow b=\overrightarrow{\omega }\cdot \overrightarrow{x_i}-y_i }[/math]
得到偏移量 [math]\displaystyle{ b }[/math]。(注意由于 [math]\displaystyle{ y_i=\pm 1 }[/math] 因而 [math]\displaystyle{ y_{i}^{-1}=y_{i} }[/math])。
核技巧
假设我们要学习与变换后数据点 [math]\displaystyle{ \varphi(\vec x_i) }[/math] 的线性分类规则对应的非线性分类规则。此外,我们有一个满足 [math]\displaystyle{ k(\vec x_i, \vec x_j) = \varphi(\vec x_i) \cdot \varphi(\vec x_j) }[/math] 的核函数 [math]\displaystyle{ k }[/math]。
我们知道变换空间中的分类向量[math]\displaystyle{ \vec w }[/math] 满足:
[math]\displaystyle{ \overrightarrow{\omega }=\sum_{i=1}^{n}c_iy_i\varphi (\overrightarrow{x_i}) }[/math]
其中 [math]\displaystyle{ c_i }[/math] 可以通过求解优化问题:
[math]\displaystyle{ \begin{align} \text{maximize}\,\, f(c_1 \ldots c_n) &= \sum_{i=1}^n c_i - \frac 1 2 \sum_{i=1}^n\sum_{j=1}^n y_ic_i(\varphi(\vec x_i) \cdot \varphi(\vec x_j))y_jc_j \\ &= \sum_{i=1}^n c_i - \frac 1 2 \sum_{i=1}^n\sum_{j=1}^n y_ic_ik(\vec x_i,\vec x_j)y_jc_j \\ \end{align} }[/math]
[math]\displaystyle{ \text{subject to } \sum_{i=1}^n c_iy_i = 0,\,\text{and } 0 \leq c_i \leq \frac{1}{2n\lambda}\;\text{for all }i. }[/math]
得到。与前面一样,可以使用二次规划来求解系数 [math]\displaystyle{ c_i }[/math]。同样,我们可以找到让 [math]\displaystyle{ 0 \lt c_i \lt (2n\lambda)^{-1} }[/math] 的索引 [math]\displaystyle{ i }[/math],使得 [math]\displaystyle{ \varphi(\vec x_i) }[/math] 位于变换空间中间隔的边界上,然后求解:
[math]\displaystyle{ \begin{align} b = \vec w \cdot \varphi(\vec x_i) - y_i &= \left[\sum_{k=1}^n c_ky_k\varphi(\vec x_k)\cdot\varphi(\vec x_i)\right] - y_i \\ &= \left[\sum_{k=1}^n c_ky_kk(\vec x_k, \vec x_i)\right] - y_i. \end{align} }[/math]
最后,可以通过计算下式来分类新点:
[math]\displaystyle{ \vec z \mapsto sgn(\vec w \cdot \varphi(\vec z) + b) = sgn\left(\left[\sum_{i=1}^n c_iy_ik(\vec x_i, \vec z)\right] + b\right). }[/math]
现代方法
如今用于寻找SVM分类器的算法包括次梯度下降和坐标下降。当处理大的稀疏数据集时,这两种技术已经均有着显著的优点——当存在许多训练实例时次梯度法是特别有效的,而当特征空间的维度高时,坐标下降特别有效。
次梯度下降
SVM的次梯度下降算法直接用表达式
[math]\displaystyle{ f(\vec w, b) = \left[\frac 1 n \sum_{i=1}^n \max\left(0, 1 - y_i(w\cdot x_i + b)\right) \right] + \lambda\lVert w \rVert^2. }[/math]
注意 [math]\displaystyle{ f }[/math] 是 [math]\displaystyle{ \vec w }[/math] 与 [math]\displaystyle{ b }[/math] 的凸函数。因此,可以采用传统的梯度下降(或SGD)方法,其不是在函数梯度的方向上前进,而是在从函数的次梯度中选出的向量的方向上前进。该方法的优点在于,对于某些实现,迭代次数不随着数据点的数量 [math]\displaystyle{ n }[/math] 而增加或减少。[16]
坐标下降
SVM的坐标下降算法基于对偶问题
[math]\displaystyle{ \text{maximize}\,\, f(c_1 \ldots c_n) = \sum_{i=1}^n c_i - \frac 1 2 \sum_{i=1}^n\sum_{j=1}^n y_ic_i(x_i \cdot x_j)y_jc_j, }[/math]
[math]\displaystyle{ \text{subject to } \sum_{i=1}^n c_iy_i = 0,\,\text{and } 0 \leq c_i \leq \frac{1}{2n\lambda}\;\text{for all }i. }[/math]
对所有 [math]\displaystyle{ i\in \left \{ 1,...,n \right \} }[/math] 进行迭代,使系数 [math]\displaystyle{ c_i }[/math] 的方向与 [math]\displaystyle{ \partial f/ \partial c_i }[/math] 一致。然后,将所得的系数向量 [math]\displaystyle{ (c_1',\,\ldots,\,c_n') }[/math] 投影到满足给定约束的最接近的系数向量(通常使用欧氏距离)。然后重复该过程,直到获得接近最佳的系数向量。尽管已证明的性能保证很少,其所得的算法在实践中运行的非常快。[17]
经验风险最小化
上文所描述的软间隔支持向量机是经验风险最小化(ERM)算法用于铰链损失(hinge loss)的一个例子。从这方面看,支持向量机属于推断统计学算法的一个自然类,而它许多独特的特点都缘于合页损失的行为。这一观点可以提供对于SVMs如何工作以及为何有效这一问题更深入的了解,并让我们更好的分析他们的统计性质。
风险最小化
在监督学习中,给定一个训练实例集合[math]\displaystyle{ X_{1}...X_{n} }[/math] 及对应标签[math]\displaystyle{ y_{1}...y_{n} }[/math],我们希望利用给定的[math]\displaystyle{ X_{n+1} }[/math]预测[math]\displaystyle{ y(n+1) }[/math]。为实现这一预测我们给出假设,[math]\displaystyle{ f }[/math],例如[math]\displaystyle{ f(X_{n+1}) }[/math]是[math]\displaystyle{ y(n+1) }[/math]的一个“好”近似值。“好”近似值通常由损失函数[math]\displaystyle{ \ell(y,z) }[/math]定义,损失函数描述作为[math]\displaystyle{ y }[/math]的预测值[math]\displaystyle{ z }[/math]的不准确度。我们希望选择一个最小化期望风险的假设:
[math]\displaystyle{ \varepsilon (f)=\mathbb{E}\left [ \ell(y_{n+1},f(X_{n+1})) \right ] }[/math].
在大多数情况下,我们不知道[math]\displaystyle{ X_{n+1} }[/math]和[math]\displaystyle{ y(n+1) }[/math]的联合分布,因此,通常的策略是选择一个最小化经验风险的假设:
[math]\displaystyle{ \hat{\varepsilon }(f)=\frac{1}{n}\sum_{k=1}^{n}\ell(y_{k},f(X_{k})) }[/math].
在某些关于随机变量[math]\displaystyle{ X_{k} }[/math]和[math]\displaystyle{ y_{k} }[/math]序列(例如由有限马尔可夫过程产生)的假设下,如果该假设集合足够小,那么随着[math]\displaystyle{ n }[/math]的增大,经验风险的最小化将近似接近期望风险的最小化。这一过程被叫做经验风险最小化,简称ERM。
正则化和稳定性
为了最小化问题有一个良好定义的解决方法,我们必须对所考虑的假设集合[math]\displaystyle{ \mathcal{H} }[/math]给出约束条件。如果[math]\displaystyle{ \mathcal{H} }[/math]是一个赋范向量空间(例如SVM),一个有效的特殊办法是仅考虑满足[math]\displaystyle{ \left \| f \right \|_{\mathcal H}\lt k }[/math]这一条件的假设[math]\displaystyle{ f }[/math]。这等同于添加一项“正则化惩罚”[math]\displaystyle{ \mathcal R(f)=\lambda \left \| f \right \|_{\mathcal H} }[/math],并解决这一新的优化问题。
- [math]\displaystyle{ \hat f = \mathrm{arg}\min_{f \in \mathcal{H}} \hat \varepsilon(f) + \mathcal{R}(f). }[/math]
该方法被称作吉洪诺夫正则化。
一般来说,[math]\displaystyle{ R(f) }[/math]可以衡量假设[math]\displaystyle{ f }[/math]的复杂度,因此更倾向于更简单的假设。
SVM与铰链损失
利用(软间隔)SVM分类器[math]\displaystyle{ \overrightarrow{\omega} ,b:x\mapsto sgn(\overrightarrow{\omega }\cdot \overrightarrow{x}-b) }[/math]对以下表达式求最小化解:
- [math]\displaystyle{ \left[\frac 1 n \sum_{i=1}^n \max\left(0, 1 - y_i(w\cdot x_i - b)\right) \right] + \lambda\lVert w \rVert^2. }[/math]
从上述讨论我们可以看到,SVM技术等同于经验风险最小化加上吉洪诺夫正则化,此时的损失函数是铰链损失:
- [math]\displaystyle{ \ell(y,z) = \max\left(0, 1 - yz \right). }[/math]
在这一观点下, SVM与其他基础的分类算法联系紧密,如 正则化最小二乘法 and 逻辑回归。这三者的不同在于损失函数的选择:正则化最小二乘法统计经验风险最小化使用平方损失函数, [math]\displaystyle{ \ell_{sq}(y,z) = (y-z)^2 }[/math];逻辑回归使用对数损失函数,
- [math]\displaystyle{ \ell_{\log}(y,z) = \ln(1 + e^{-yz}). }[/math]
目标函数
合页损失与其他损失函数区别主要在于“目标函数”,而目标函数使一对给定的随机变量[math]\displaystyle{ X,y }[/math]期望风险最小化。 特别的,在 [math]\displaystyle{ X = x }[/math]事件的条件下,让[math]\displaystyle{ y_x }[/math] 表示 [math]\displaystyle{ y }[/math]。在这个分类集合里,我们有:
- [math]\displaystyle{ y_x = \begin{cases} 1 & \text{with probability } p_x \\ -1 & \text{with probability } 1-p_x \end{cases} }[/math]
那么最理想分类器为:
- [math]\displaystyle{ f^*(x) = \begin{cases}1 & \text{if }p_x \geq 1/2 \\ -1 & \text{otherwise}\end{cases} }[/math]
对于平方损失,目标函数就是条件期望函数,[math]\displaystyle{ f_{sq}(x) }[/math][math]\displaystyle{ =\mathbb{E}[y_{x}] }[/math];而对于对数损失,目标函数是逻辑函数,[math]\displaystyle{ f_{\log}(x) = \ln\left(p_x / ({1-p_x})\right) }[/math]。当这两个目标函数都是正确分类器,即 [math]\displaystyle{ {sgn\left ( f_{sq} \right )= sgn \left ( f_{log} \right )= f^{*}} }[/math],它们能给我们信息要比我们需要的更多。实际上,他们能给我们充足的信息来充分描绘[math]\displaystyle{ y_x }[/math]的分布。
在另一方面,合页损失的目标函数正是[math]\displaystyle{ f^* }[/math]。因此,在充分假设空间,或适当选择的核,SVM分类器会趋于可实现正确数据分类的最简单函数( [math]\displaystyle{ \mathcal{R} }[/math])。这一方面拓展了SVM的几何解释:对于线性分类,间隔在支持向量和最简单的最大间隔分类器之间的函数使得经验风险最小化。[18]
性质
SVM属于广义线性分类器的一族,并且可以解释为感知机的延伸。它们也可以被认为是提克洛夫规范化的特例。它们有一个特别的性质,就是可以同时最小化经验误差和最大化几何边缘区; 因此它们也被称为最大间隔分类器。
Meyer、Leisch和Hornik对SVM与其他分类器进行了比较。[19]
参数选择
SVM的有效性取决于核函数、核参数和软间隔参数 C 的选择。 通常会选只有一个参数 [math]\displaystyle{ \gamma }[/math] 的高斯核。C 和 [math]\displaystyle{ \gamma }[/math] 的最佳组合通常通过在 C 和 [math]\displaystyle{ \gamma }[/math] 为指数增长序列下网格搜索来选取,例如 [math]\displaystyle{ C \in \{ 2^{-5}, 2^{-3}, \dots, 2^{13},2^{15} \} }[/math]; [math]\displaystyle{ \gamma \in \{ 2^{-15},2^{-13}, \dots, 2^{1},2^{3} \} }[/math]。通常情况下,使用交叉验证来检查参数选择的每一个组合,并选择具有最佳交叉验证精度的参数。贝叶斯优化的一些近期工作可以用于选择C和γ,通常只需要评估比网格搜索少得多的参数组合。然后,使用所选择的参数在整个训练集上训练用于测试和分类新数据的最终模型。[20]
问题
SVM的潜在缺点包括以下方面:
- 需要对输入数据进行完全标记
- 未校准类成员概率——起源于Vapnik理论的SVM避免了在有限数据中估计概率。
- SVM仅直接适用于两类任务。因此,必须应用将多类任务减少到几个二元问题的算法;请参阅多类SVM一节。
- 解出的模型的参数很难理解。
延伸
支持向量聚类
支持向量聚类是一种建立在核函数上的类似方法,同样适用于无监督学习和数据挖掘。它被认为是数据科学中的一种基本方法。
多元分类SVM
多元分类SVM旨在应用支持向量机对实例赋上标签,标签是从一个含几种元素的有限集合拟定的。
主要的方法是将单独的多元分类问题降到多个二元分类问题。[21]通常有以下几种方法:[21][22]
- 构造二元分类器区分(i)其中一个标签及剩余标签(一对多)或(ii)每一个对类(一对一)。一对多情况下对新实例进行分类由胜者全得策略完成,由最高输出函数的分类器分类(输出函数的分数必须标准化)。一对一情况下采用投票策略,每一分类器将实例赋给两类中的一类,最终拥有最多票数的类决定实例分类。
- 有向无环图SVM (DAGSVM)[23]
- 纠错输出编码[24]
Crammer和Singer提议多元分类SVM将多类分类问题变成单个优化问题而不是分解为多个二元分类问题。[25]也可以参考Lee,Lin和Wahba的论文。[26] [27]
转导支持向量机
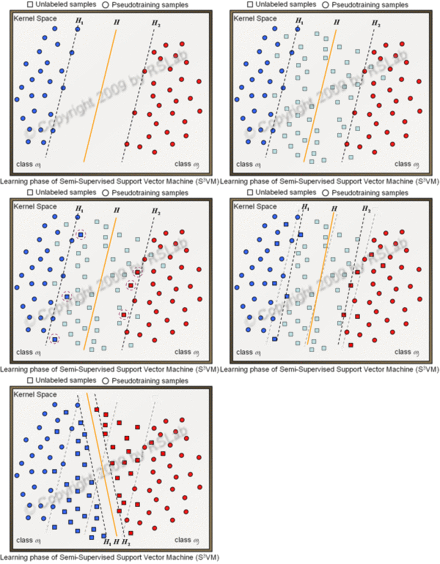
转导支持向量机拓展了SVMs,通过转导法则,它们也可以在半监督学习中处理部分标注数据。除了训练集 [math]\displaystyle{ D }[/math],学习器也被赋予一个待分类的测试实例集合。
- [math]\displaystyle{ \mathcal{D}^\star = \{ \vec{x}^\star_i \mid \vec{x}^\star_i \in \mathbb{R}^p\}_{i=1}^k \, }[/math]
转导支持向量机由以下主要的优化问题定义:[28]
最小化 (在 [math]\displaystyle{ {\vec{w}, b, \vec{y^\star}} }[/math]中)
- [math]\displaystyle{ \frac{1}{2}\|\vec{w}\|^2 }[/math]
受约束于 (对任意 [math]\displaystyle{ i = 1, \dots, n }[/math] 和任意 [math]\displaystyle{ j = 1, \dots, k }[/math])
- [math]\displaystyle{ y_i(\vec{w}\cdot\vec{x_i} - b) \ge 1,\, }[/math]
- [math]\displaystyle{ y^\star_j(\vec{w}\cdot\vec{x^\star_j} - b) \ge 1, }[/math]
以及
- [math]\displaystyle{ y^\star_{j} \in \{-1, 1\}.\, }[/math]
转导支持向量机由Vladimir N. Vapnik于1998年提出。
结构化支持向量机
支持向量机可以被拓展为结构化的支持向量机,推广后标签空间是结构化的并且可能具有无限的大小。
回归
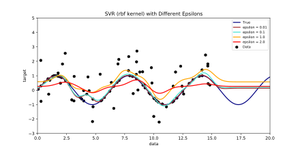
回归 形式的支持向量机于1996年由Vladimir N. Vapnik, Harris Drucker, Christopher J. C. Burges, Linda Kaufman and Alexander J. Smola提出。[29]该方法称为支持向量回归(SVR)。支持向量分类的模型仅依靠训练数据的子集,因为模型的损失函数不关心边缘以外的训练点。类似的,SVR模型仅依靠因为模型的损失函数不关心边缘以外的训练点,因为模型的损失函数忽视了接近模型预测的训练数据。另一形式的SVM,即最小二乘支持向量机 已经由Suykens和Vandewalle提出。[30]
训练原始SVR意味着求解[31]
- minimize [math]\displaystyle{ \frac{1}{2} \|w\|^2 }[/math]
- subject to [math]\displaystyle{ \begin{cases} y_i - \langle w, x_i \rangle - b \le \varepsilon \\ \langle w, x_i \rangle + b - y_i \le \varepsilon \end{cases} }[/math]
其中[math]\displaystyle{ x_i }[/math]是目标值为[math]\displaystyle{ y_i }[/math]的训练样本。内积加上截距[math]\displaystyle{ \langle w, x_i \rangle + b }[/math]是样本的预测值,[math]\displaystyle{ \varepsilon }[/math]是一个作为限制的自由参量:所有的预测值都应与真实预测值在[math]\displaystyle{ \varepsilon }[/math]的范围内。通常加入松弛变量来使不可行情况下产生误差和近似值。
贝叶斯SVM
2011年,Polson和Scott运用数据增强在SVM中加入贝叶斯解释。[32]在这一方法中,SVM被视为概率图模型(参数由概率分布联系)。这一延伸视角使得贝叶斯方法应用于SVMs,例如灵活特征模型,自动超参数调优,以及预测不确定性量化。近期,一种可标度的贝叶斯SVM模型由Wenzel等提出来实现贝叶斯SVM在大数据上的应用。[33]
实现
最大间隔超平面的参数是通过求解优化得到的。有几种专门的算法可用于快速解决由SVM产生的QP问题,它们主要依靠启发式算法将问题分解成更小、更易于处理的子问题。
另一种方法是使用内点法,其使用类似牛顿法的迭代找到卡罗需-库恩-塔克条件下原型和对偶型的解。[34] 这种方法不是去解决一系列分解问题,而是直接完全解决该问题。为了避免求解核矩阵很大的线性系统,在核技巧中经常使用矩阵的低秩近似。
另一个常见的方法是普莱特的序列最小优化算法(SMO),它把问题分成了若干个可以解析求解的二维子问题,这样就可以避免使用数值优化算法和矩阵存储。[35]
线性支持向量机的特殊情况可以通过用于优化其类似问题逻辑回归的同类算法更高效求解;这类算法包括次梯度下降法(如PEGASOS[36])和坐标下降法(如LIBLINEAR[37])。LIBLINEAR有一些引人注目的训练时间上的特性。每次收敛迭代花费在读取训练数据上的时间是线性的,而且这些迭代还具有Q-线性收敛特性,使得算法非常快。
一般的核SVM也可以用次梯度下降法(P-packSVM[38])更快求解,在允许并行化时求解速度尤其快。
许多机器学习工具包都可以使用核SVM,有LIBSVM、MATLAB、SAS、SVMlight、kernlab、scikit-learn、Shogun、Weka、Shark、JKernelMachines、OpenCV等。
简单实现与演示
from sklearn.datasets.samples_generator import make_blobs

# revised from https://github.com/Madhu009/Deep-math-machine-learning.ai/blob/master/SVM-FromScratch.ipynb
# data preparation

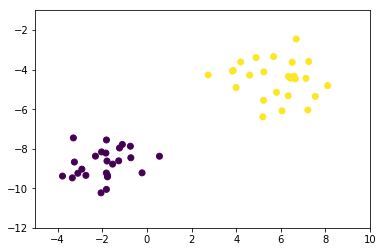
(X,y) =  make_blobs(n_samples=50,n_features=2,centers=2,cluster_std=1.05,random_state=40)
#we need to add 1 to X values (we can say its bias)
X1 = np.c_[np.ones((X.shape[0])),X]

plt.scatter(X1[:,1],X1[:,2],marker='o',c=y)
plt.axis([-5,10,-12,-1])
plt.show()
postiveX=[]
negativeX=[]
for i,v in enumerate(y):
    if v==0:
        negativeX.append(X[i])
    else:
        postiveX.append(X[i])

#our data dictionary
data_dict = {-1:np.array(negativeX), 1:np.array(postiveX)}

#all the required variables
w=[] #weights 2 dimensional vector
b=[] #bias

max_feature_value=float('-inf')
min_feature_value=float('+inf')

for yi in data_dict:
    if np.amax(data_dict[yi])>max_feature_value:
        max_feature_value=np.amax(data_dict[yi])

    if np.amin(data_dict[yi])<min_feature_value:
        min_feature_value=np.amin(data_dict[yi])

learning_rate = [max_feature_value * 0.1, max_feature_value * 0.01, max_feature_value * 0.001,]

def SVM_Training(data_dict):
    i=1
    global w
    global b
    # { ||w||: [w,b] }
    length_Wvector = {}
    transforms = [[1,1],[-1,1],[-1,-1],[1,-1]]

    b_step_size = 2
    b_multiple = 5
    w_optimum = max_feature_value*0.5

    for lrate in learning_rate:


        w = np.array([w_optimum,w_optimum])
        optimized = False
        while not optimized:
            #b=[-maxvalue to maxvalue] we wanna maximize the b values so check for every b value
            for b in np.arange(-1*(max_feature_value*b_step_size), max_feature_value*b_step_size, lrate*b_multiple):
                for transformation in transforms:  # transforms = [[1,1],[-1,1],[-1,-1],[1,-1]]
                    w_t = w*transformation

                    correctly_classified = True

                    # every data point should be correct
                    for yi in data_dict:
                        for xi in data_dict[yi]:
                            if yi*(np.dot(w_t,xi)+b) < 1:  # we want  yi*(np.dot(w_t,xi)+b) >= 1 for correct classification
                                correctly_classified = False

                    if correctly_classified:
                        length_Wvector[np.linalg.norm(w_t)] = [w_t,b] #store w, b for minimum magnitude

            if w[0] < 0:
                optimized = True
            else:
                w = w - lrate

        norms = sorted([n for n in length_Wvector])

        minimum_wlength = length_Wvector[norms[0]]
        w = minimum_wlength[0]
        b = minimum_wlength[1]

        w_optimum = w[0]+lrate*2

SVM_Training(data_dict)

def visualize(data_dict):


        #[[ax.scatter(x[0],x[1],s=100,color=colors[i]) for x in data_dict[i]] for i in data_dict]

        plt.scatter(X1[:,1],X1[:,2],marker='o',c=y)

        # hyperplane = x.w+b
        # v = x.w+b
        # psv = 1
        # nsv = -1
        # dec = 0
        def hyperplane_value(x,w,b,v):
            return (-w[0]*x-b+v) / w[1]

        datarange = (min_feature_value*0.9,max_feature_value*1.)
        hyp_x_min = datarange[0]
        hyp_x_max = datarange[1]

        # (w.x+b) = 1
        # positive support vector hyperplane
        psv1 = hyperplane_value(hyp_x_min, w, b, 1)
        psv2 = hyperplane_value(hyp_x_max, w, b, 1)
        ax.plot([hyp_x_min,hyp_x_max],[psv1,psv2], 'k')

        # (w.x+b) = -1
        # negative support vector hyperplane
        nsv1 = hyperplane_value(hyp_x_min, w, b, -1)
        nsv2 = hyperplane_value(hyp_x_max, w, b, -1)
        ax.plot([hyp_x_min,hyp_x_max],[nsv1,nsv2], 'k')

        # (w.x+b) = 0
        # positive support vector hyperplane
        db1 = hyperplane_value(hyp_x_min, w, b, 0)
        db2 = hyperplane_value(hyp_x_max, w, b, 0)
        ax.plot([hyp_x_min,hyp_x_max],[db1,db2], 'y--')

        plt.axis([-5,10,-12,-1])
        plt.show()

visualize(data_dict)
参见
- 相关向量机,是一个函数形式与支持向量机相同的概率稀疏核模型。
参考
- ↑ Cortes, Corinna; Vapnik, Vladimir N. (1995). "Support-vector networks". Machine Learning. 20 (3): 273–297. doi:10.1007/BF00994018
- ↑ Ben-Hur, Asa; Horn, David; Siegelmann, Hava; and Vapnik, Vladimir N.; "Support vector clustering"; (2001); Journal of Machine Learning Research, 2: 125–137
- ↑ "Archived copy". Archived from the original on 2017-11-08. Retrieved 2017-11-08
- ↑ Trevor_Hastie,_Robert_Tibshirani,_Jerome_Friedman - The elements of Statistical Learning Pg. 134
- ↑ *Press, William H.; Teukolsky, Saul A.; Vetterling, William T.; Flannery, Brian P. (2007). "Section 16.5. Support Vector Machines". Numerical Recipes: The Art of Scientific Computing (3rd ed.). New York: Cambridge University Press. ISBN 978-0-521-88068-8. Archived from the original on 2011-08-11.
- ↑ Vapnik, Vladimir N.: Invited Speaker. IPMU Information Processing and Management 2014)
- ↑ Barghout, Lauren. "Spatial-Taxon Information Granules as Used in Iterative Fuzzy-Decision-Making for Image Segmentation." Granular Computing and Decision-Making. Springer International Publishing, 2015. 285-318.
- ↑ DeCoste, Dennis (2002). "Training Invariant Support Vector Machines" (PDF). Machine Learning. 46: 161–190.
- ↑ Gaonkar, Bilwaj; Davatzikos, Christos; "Analytic estimation of statistical significance maps for support vector machine based multi-variate image analysis and classification"
- ↑ Cuingnet, Rémi; Rosso, Charlotte; Chupin, Marie; Lehéricy, Stéphane; Dormont, Didier; Benali, Habib; Samson, Yves; and Colliot, Olivier; "Spatial regularization of SVM for the detection of diffusion alterations associated with stroke outcome", Medical Image Analysis, 2011, 15 (5): 729–737
- ↑ Statnikov, Alexander; Hardin, Douglas; & Aliferis, Constantin; (2006); "Using SVM weight-based methods to identify causally relevant and non-causally relevant variables", Sign, 1, 4
- ↑ 12.0 12.1 Boser, Bernhard E.; Guyon, Isabelle M.; Vapnik, Vladimir N. (1992). "A training algorithm for optimal margin classifiers". Proceedings of the fifth annual workshop on Computational learning theory – COLT '92. p. 144. doi:10.1145/130385.130401. ISBN 089791497X.
- ↑ "Why does the SVM margin is [math]\displaystyle{ \frac{2}{\mathbf{w}} }[/math] ".Mathematics Stack Exchange.
- ↑ Aizerman, Mark A.; Braverman, Emmanuel M.; Rozonoer, Lev I. (1964). "Theoretical foundations of the potential function method in pattern recognition learning". Automation and Remote Control. 25: 821–837.
{{cite journal}}: Unknown parameter|last-author-amp=ignored (help) - ↑ Jin, Chi; Wang, Liwei (2012). Dimensionality dependent PAC-Bayes margin bound. Advances in Neural Information Processing Systems. Archived from the original on 2015-04-02.
- ↑ Shalev-Shwartz, Shai; Singer, Yoram; Srebro, Nathan; Cotter, Andrew (2010-10-16). "Pegasos: primal estimated sub-gradient solver for SVM". Mathematical Programming. 127 (1): 3–30. doi:10.1007/s10107-010-0420-4. ISSN 0025-5610.
- ↑ Hsieh, Cho-Jui; Chang, Kai-Wei; Lin, Chih-Jen; Keerthi, S. Sathiya; Sundararajan, S. (2008-01-01). "A Dual Coordinate Descent Method for Large-scale Linear SVM". Proceedings of the 25th International Conference on Machine Learning. ICML '08. New York, NY, USA: ACM: 408–415. doi:10.1145/1390156.1390208 .ISBN 978-1-60558-205-4.
- ↑ Rosasco, Lorenzo; De Vito, Ernesto; Caponnetto, Andrea; Piana, Michele; Verri, Alessandro (2004-05-01). "Are Loss Functions All the Same?". Neural Computation. 16 (5): 1063–1076. CiteSeerX 10.1.1.109.6786 Freely accessible. doi:10.1162/089976604773135104. ISSN 0899-7667. PMID 15070510.
- ↑ Meyer, David; Leisch, Friedrich; Hornik, Kurt (2003). "The support vector machine under test". Neurocomputing. 55: 169. doi:10.1016/S0925-2312(03)00431-4.
- ↑ Hsu, Chih-Wei; Chang, Chih-Chung & Lin, Chih-Jen (2003). A Practical Guide to Support Vector Classification (PDF) (Technical report). Department of Computer Science and Information Engineering, National Taiwan University. Archived (PDF) from the original on 2013-06-25.
- ↑ 21.0 21.1 Duan, Kai-Bo; Keerthi, S. Sathiya (2005). "Which Is the Best Multiclass SVM Method? An Empirical Study". Multiple Classifier Systems. LNCS. 3541. pp. 278–285. doi:10.1007/11494683_28. ISBN 978-3-540-26306-7.
- ↑ Hsu, Chih-Wei & Lin, Chih-Jen (2002). "A Comparison of Methods for Multiclass Support Vector Machines" (PDF). IEEE Transactions on Neural Networks.
- ↑ Platt, John; Cristianini, Nello; Shawe-Taylor, John (2000). "Large margin DAGs for multiclass classification". In Solla, Sara A.; Leen, Todd K.; and Müller, Klaus-Robert; eds. Advances in Neural Information Processing Systems (PDF). MIT Press. pp. 547–553. Archived (PDF) from the original on 2012-06-16.
- ↑ Dietterich, Thomas G.; Bakiri, Ghulum (1995). "Solving Multiclass Learning Problems via Error-Correcting Output Codes" (PDF). Journal of Artificial Intelligence Research. 2: 263–286. arXiv:cs/9501101 Bibcode:1995cs........1101D. Archived (PDF) from the original on 2013-05-09..
- ↑ Crammer, Koby & Singer, Yoram (2001). "On the Algorithmic Implementation of Multiclass Kernel-based Vector Machines" (PDF). Journal of Machine Learning Research. 2: 265–292. Archived (PDF) from the original on 2015-08-29.
- ↑ Lee, Yoonkyung; Lin, Yi & Wahba, Grace (2001). "Multicategory Support Vector Machines" (PDF). Computing Science and Statistics. 33. Archived (PDF) from the original on 2013-06-17.
- ↑ Lee, Yoonkyung; Lin, Yi; Wahba, Grace (2004). "Multicategory Support Vector Machines". Journal of the American Statistical Association. 99 (465): 67. doi:10.1198/016214504000000098.
- ↑ Joachims, Thorsten; "Transductive Inference for Text Classification using Support Vector Machines", Proceedings of the 1999 International Conference on Machine Learning (ICML 1999), pp. 200–209
- ↑ Drucker, Harris; Burges, Christopher J. C.; Kaufman, Linda; Smola, Alexander J.; and Vapnik, Vladimir N. (1997); "Support Vector Regression Machines", in Advances in Neural Information Processing Systems 9, NIPS 1996, 155–161, MIT Press.
- ↑ Suykens, Johan A. K.; Vandewalle, Joos P. L.; "Least squares support vector machine classifiers", Neural Processing Letters, vol. 9, no. 3, Jun. 1999, pp. 293–300
- ↑ Alex J.Smola,Bernhard Schölkopf(2004) A tutorial on support vector regression
- ↑ Polson, Nicholas G.; Scott, Steven L. (2011). "Data Augmentation for Support Vector Machines". Bayesian Analysis. 6 (1): 1–23. doi:10.1214/11-BA601.
- ↑ Wenzel, Florian; Galy-Fajou, Theo; Deutsch, Matthäus; Kloft, Marius (2017). "Bayesian Nonlinear Support Vector Machines for Big Data". Machine Learning and Knowledge Discovery in Databases (ECML PKDD). arXiv:1707.05532. Bibcode:2017arXiv170705532W.
- ↑ Ferris, Michael C.; Munson, Todd S. (2002). "Interior-Point Methods for Massive Support Vector Machines" (PDF). SIAM Journal on Optimization. 13 (3): 783. doi:10.1137/S1052623400374379. Archived (PDF) from the original on 2008-12-04.
- ↑ Platt, John C. (1998). Sequential Minimal Optimization: A Fast Algorithm for Training Support Vector Machines (PDF). NIPS. Archived (PDF) from the original on 2015-07-02.
- ↑ Shalev-Shwartz, Shai; Singer, Yoram; Srebro, Nathan (2007). Pegasos: Primal Estimated sub-GrAdient SOlver for SVM (PDF). ICML. Archived (PDF) from the original on 2013-12-15.
- ↑ Fan, Rong-En; Chang, Kai-Wei; Hsieh, Cho-Jui; Wang, Xiang-Rui; Lin, Chih-Jen (2008). "LIBLINEAR: A library for large linear classification" (PDF). Journal of Machine Learning Research. 9: 1871–1874.
- ↑ Allen Zhu, Zeyuan; Chen, Weizhu; Wang, Gang; Zhu, Chenguang; Chen, Zheng (2009). P-packSVM: Parallel Primal grAdient desCent Kernel SVM (PDF). ICDM. Archived (PDF) from the original on 2014-04-07.
文献
- Theodoridis, Sergios; and Koutroumbas, Konstantinos; Pattern Recognition, 4th Edition, Academic Press, 2009, ISBN|978-1-59749-272-0
- Cristianini, Nello; and Shawe-Taylor, John; An Introduction to Support Vector Machines and other kernel-based learning methods, Cambridge University Press, 2000. ISBN|0-521-78019-5 (SVM Book)
- Huang, Te-Ming; Kecman, Vojislav; and Kopriva, Ivica; (2006); "Kernel Based Algorithms for Mining Huge Data Sets", in Supervised, Semi-supervised, and Unsupervised Learning, Springer-Verlag, Berlin, Heidelberg, 260 pp. 96 illus., Hardcover, ISBN|3-540-31681-7
- Kecman, Vojislav; Learning and Soft Computing — Support Vector Machines, Neural Networks, Fuzzy Logic Systems, The MIT Press, Cambridge, MA, 2001
- Schölkopf, Bernhard; and Smola, Alexander J.; Learning with Kernels, MIT Press, Cambridge, MA, 2002. ISBN|0-262-19475-9
- Schölkopf, Bernhard; Burges, Christopher J. C.; and Smola, Alexander J. (editors); Advances in Kernel Methods: Support Vector Learning, MIT Press, Cambridge, MA, 1999. ISBN|0-262-19416-3
- Shawe-Taylor, John; and Cristianini, Nello; Kernel Methods for Pattern Analysis, Cambridge University Press, 2004. ISBN|0-521-81397-2 (Kernel Methods Book)
- Steinwart, Ingo; and Christmann, Andreas; Support Vector Machines, Springer-Verlag, New York, 2008. ISBN|978-0-387-77241-7 (SVM Book)
- Tan, Peter Jing; and Dowe, David L. (2004); MML Inference of Oblique Decision Trees, Lecture Notes in Artificial Intelligence (LNAI) 3339, Springer-Verlag, pp. 1082–1088 (This paper uses minimum message length (MML) and actually incorporates probabilistic support vector machines in the leaves of Decision tree learning|decision trees)
- Vapnik, Vladimir N.; The Nature of Statistical Learning Theory, Springer-Verlag, 1995. ISBN|0-387-98780-0
- Vapnik, Vladimir N.; and Kotz, Samuel; Estimation of Dependences Based on Empirical Data, Springer, 2006. ISBN|0-387-30865-2 (this is a reprint of Vapnik's early book describing philosophy behind SVM approach; the 2006 Appendix describes recent developments)
- Fradkin, Dmitriy; and Muchnik, Ilya; "Support Vector Machines for Classification" in Abello, J.; and Carmode, G. (Eds); Discrete Methods in Epidemiology, DIMACS Series in Discrete Mathematics and Theoretical Computer Science, volume 70, pp. 13–20, 2006 (Succinctly describes theoretical ideas behind SVM)
- Bennett, Kristin P.; and Campbell, Colin; "Support Vector Machines: Hype or Hallelujah?", SIGKDD Explorations, 2, 2, 2000, 1–13 (Excellent introduction to SVMs with helpful figures)
- Ivanciuc, Ovidiu; "Applications of Support Vector Machines in Chemistry", in Reviews in Computational Chemistry, Volume 23, 2007, pp. 291–400
- Catanzaro, Bryan; Sundaram, Narayanan; and Keutzer, Kurt; "Fast Support Vector Machine Training and Classification on Graphics Processors", in International Conference on Machine Learning, 2008
- Campbell, Colin; and Ying, Yiming; Learning with Support Vector Machines, Morgan and Claypool, 2011 ISBN|978-1-60845-616-1
- Ben-Hur, Asa; Horn, David; Siegelmann, Hava; and Vapnik, Vladimir; "Support vector clustering" (2001) Journal of Machine Learning Research, 2: 125–137
外部链接
- libsvm, LIBSVM是一个有名的SVM学习库。
- liblinear 是一个的大线性分类库,其中包含一些SVMs。is a library for large linear classification including some SVMs
- SVM light is a collection of software tools for learning and classification using SVM
- SVMJS live demo is a GUI demo for JavaScript implementation of SVMs
编者推荐
论文共享:基于新型计算框架的多类 Twitter 数据分类与地理编码
本研究以一个新颖的运输资料分析架构,配合运输资料分析技术的不断发展,详细阐述了运输资料分析的进展。 这个计算框架结合了标记隐含狄利克雷分布分类器(L-LDA)和支持计算策略的支持向量机分类器(SVM) ,用于确定与交通相关的事件,为旅行者提供可靠的信息。
论文共享:情感分析中预处理步骤对机器学习算法准确性的影响
近年来,大数据及其相关技术已成为研究的热点领域。 每一分每一秒都有大量的数据产生,其中包括当今研究人员感兴趣的非结构化数据。 本文研究了不同的预处理步骤对三种情感分析机器学习算法精度的影响。 采用粗糙贝叶斯(NB)、最大熵(MaxE)和支持向量机(SVM)三种著名的机器学习分类器,应用不同的文本预处理技术,研究了它们对情感分类精度的影响。
好课分享:从Python到机器学习
本课程针对不同技术起点的学习人群,特别挑选了多套多阶段的AI视频教程。本套教程幽默风趣、简单明了。如果你有心学习人工智能技术,那么你将从基础知识开始,循序渐进的掌握深度学习知识,最终通过亲手搭建多种神经网络,解决机器学习问题,掌握深度学习技术,点亮自己的人工智能技能树!
本中文词条由乌丢丢 翻译编辑,由 HengFlynn 审校,张江总审校,费米子编辑,欢迎在讨论页面留言。
本词条内容源自wikipedia及公开资料,遵守 CC3.0协议。
