介数中心性
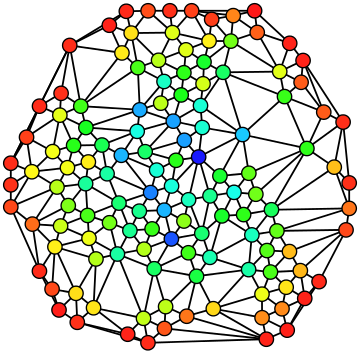
根据每个顶点的介数中心性从最小(红色)到最大(蓝色)着色的无向图。
在图论中,介数中心性Betweenness centrality是基于最短路径的图中心性的一种度量。对于连通图中的每一对节点,在节点之间至少存在一条最短路径,使得路径通过的边数(对于未加权图)或者边权重的和(对于加权图)最小。节点的中心性是经过该节点的最短路径的数量。
介数中心性Betweenness centrality的提出为中心性的衡量提供了一般的标准: 它适用于网络理论中广泛的问题,包括与社会网络、生物学、交通和科学合作有关的问题。尽管早期的学者直观地将中心性描述为基于介数,但是给出了 介数中心性Betweenness centrality的第一个正式定义。
介数中心性Betweenness centrality在网络理论中有着广泛的应用,它代表了节点之间相互独立的程度。例如,在远程通信网络中,具有较高 介数中心性Betweenness centrality的节点将对网络有更多的控制,因为有更多的信息会通过该节点。
定义
一个节点 [math]\displaystyle{ v }[/math] 的 介数中心性Betweenness centrality通过以下表达式给出:
- [math]\displaystyle{ g(v)= \sum_{s \neq v \neq t}\frac{\sigma_{st}(v)}{\sigma_{st}} }[/math]
其中 [math]\displaystyle{ sigma { st } }[/math] 是从节点 [math]\displaystyle{ s }[/math] 到节点 [math]\displaystyle{ t }[/math]的最短路径总数, [math]\displaystyle{ sigma { st }(v) }[/math]是其中通过节点[math]\displaystyle{ v }[/math]的路径数量。
注意,如公式中求和指标所示,一个节点的介数中心性Betweenness centrality与节点对的数量成比例缩放。因此,计算可以通过除以不包括 [math]\displaystyle{ v }[/math] 的节点对数来重新标定,使得[math]\displaystyle{ g \in [0,1] }[/math]。有向图是通过除以 [math]\displaystyle{ (N-1)(N-2) }[/math] 来实现的,而无向图是通过除以 [math]\displaystyle{ (N-1)(N-2)/2 }[/math]来实现的,其中 [math]\displaystyle{ n }[/math] 是巨组元中的节点数。请注意,当每一条最短路径都通过一个节点时,这个节点达到可以缩放的最大可能值。事实往往并非如此,可以在不损失精度的情况下执行标准化
- [math]\displaystyle{ \mbox{normal}(g(v)) = \frac{g(v) - \min(g)}{\max(g) - \min(g)} }[/math]
结果是:
- [math]\displaystyle{ \max(normal) = 1 }[/math]
- [math]\displaystyle{ \min(normal) = 0 }[/math]
请注意,这种方法将始终是从较小范围到较大范围的缩放,因此不会丢失精度。
真实网络和模型网络中的负荷分配
模型网络
结果表明,无标度网络的负荷分布遵循由负载指数[math]\displaystyle{ \delta }[/math]所给出的幂律
- [math]\displaystyle{ P(g) \approx g^{-\delta} }[/math] (1)
这意味着缩放与节点度相关,
- [math]\displaystyle{ g(k) \approx k^\eta }[/math].
其中 [math]\displaystyle{ g (k) }[/math] 是度为 [math]\displaystyle{ k }[/math] 的节点的平均负载。指数 [math]\displaystyle{ delta }[/math] 和 [math]\displaystyle{ eta }[/math] 不是独立的,因为方程(1)指出[2]
- [math]\displaystyle{ P(g)= \int P(k) \delta (g-k^\eta) dk }[/math]
对于大 g,也就是大 k,表达式变成
- [math]\displaystyle{ P(g\gg1)= \int k^{-\gamma} \delta (g-k^\eta) dk }[/math]
- [math]\displaystyle{ \sim g^{-1-\frac{\gamma -1}{\eta}} }[/math]
证明了如下等式:
- [math]\displaystyle{ \eta=\frac{\gamma -1}{\delta -1} }[/math]
重要的指数是 [math]\displaystyle{ eta }[/math] ,它描述了介数中心性Betweenness centrality如何依赖于连通性。当所有的最短路径都经过一个节点时,这种情况使节点的介数中心性Betweenness centrality最大化,这对应于一个树结构(一个没有分簇的网络)。在树形网络的情况下,达到了 [math]\displaystyle{ eta = 2 }[/math] 的最大值。
- [math]\displaystyle{ \eta = 2 \rarr \delta = \frac{\gamma +1}{2} }[/math]
[math]\displaystyle{ eta }[/math] 的最大值(也是 <mat > delta </math> 的最小值)为具有 非零分簇 Non-vanishing clustering的网络的负载指数设置了界限。
- [math]\displaystyle{ \eta \le 2 \rarr \delta \ge \frac{\gamma +1}{2} }[/math]
在这种情况下,指数 <mat > delta,eta </math> 并不是通用的,取决于不同的细节(平均连接性、相关性等)。
真实网络
现实世界中的 无标度网络Scale free networks,如互联网,也遵循幂律负载分布。[3] 这是一个直观的结果。无标度网络通过创建一些比大多数网络具有更高连通性的枢纽节点,从而在网络中实现较短的路径长度。由于这种额外的连接,这些枢纽节点自然会承担更高的负载。
加权网络
在加权网络中,连接节点的链路不再被视为二元的相互作用,而是根据其容量、影响力、频率等按比例加权,这在拓扑效应之外增加了网络内另一个异质性的维度。一个加权网络中的节点的强度是由其相邻边的权重之和来表示的。
- [math]\displaystyle{ s_{i} = \sum_{j=1}^{N} a_{ij}w_{ij} }[/math]
用 [math]\displaystyle{ a{ij} }[/math] 和 [math]\displaystyle{ w{ij} }[/math] 分别作为 [math]\displaystyle{ i }[/math] 和 [math]\displaystyle{ j }[/math] 节点之间的邻接矩阵和权值矩阵。
类似于 无标度网络Scale free networks中度的幂律分布 Power law distribution,节点的强度也服从 幂律分布Power law distribution。
- [math]\displaystyle{ s(k) \approx k^\beta }[/math]
对具有介数[math]\displaystyle{ b }[/math]的节点强度的平均值[math]\displaystyle{ s(b) }[/math]的研究表明,功能行为可以用缩放形式来近似[4]
- [math]\displaystyle{ s(b)\approx b^{\alpha} }[/math]
渗流中心性
渗流中心性 Percolation centrality是加权的介数中心性Betweenness centrality的一种形式,但它在计算该权重时考虑了每条最短路径的源节点和目标节点的“状态”。在许多情况下,复杂网络中都会出现“传染”的渗流现象。例如,病毒或细菌感染可以通过人们的社交网络传播,也就是所谓的接触网络。还可以在更高的抽象层次上考虑疾病的传播问题,设想通过公路、铁路或空中连接起来的城镇或人口中心网络。计算机病毒可以通过计算机网络传播。关于商业活动和交易的谣言或新闻也可以通过人们的社交网络传播。在所有这些情况下,一种“传染病”在一个复杂网络的链接上传播,随着它的传播,无论是可恢复的还是不可恢复的,都会改变节点的“状态”。例如,在流行病学情况下,随着传染病的扩散,个体从“易感”状态转变为“感染”状态。在上面的例子中,随着传染病的传播,每个节点的状态可以是二元的(如接收/没有接收到一条信息)、离散的(易感/受感染/康复),甚至是连续的(如一个城镇中受感染的人群比例)。这些情景的共同特点是,传染病的传播导致网络中节点状态的改变。渗流中心性Percolation centrality (PC)就是基于这个思想而提出的,它衡量了节点在帮助网络渗流方面的重要性。这个测度是由 Piraveenan 等人提出的。[5]
渗流中心性Percolation centrality 定义了在给定时间内,通过一个给定节点的渗流路径的比例。“渗流路径”是一对节点之间的最短路径,其中源节点被渗流的(例如,被感染)。目标节点可以是渗流的或非渗流的,或处于部分渗流状态。
- [math]\displaystyle{ PC^t(v)= \frac{1}{N-2}\sum_{s \neq v \neq r}\frac{\sigma_{sr}(v)}{\sigma_{sr}}\frac{{x^t}_s}{{\sum {[{x^t}_i}]}-{x^t}_v} }[/math]
其中, [math]\displaystyle{ \sigma_{sr} }[/math] 是从节点 [math]\displaystyle{ s }[/math] 到节点 [math]\displaystyle{ r }[/math] 的最短路径的数量总数, [math]\displaystyle{ \sigma_{sr}(v) }[/math] 是其中通过节点 [math]\displaystyle{ v }[/math] 的路径总数。在时间 [math]\displaystyle{ t }[/math] 时,节点的渗流状态用 [math]\displaystyle{ {x^t}_i }[/math] 表示,两个特殊情况是当 [math]\displaystyle{ {x^t}_i=0 }[/math], 表示在时间[math]\displaystyle{ t }[/math]时是非渗流状态,而当 [math]\displaystyle{ {x^t}_i=1 }[/math]时, 表示在时间[math]\displaystyle{ t }[/math]时是完全渗流状态。两者之间的值表示部分渗流状态(例如,在一个城镇网络中,这是该城镇感染者的百分比)。
渗流路径的权重取决于分配给源节点的渗流水平,前提是源节点的渗流水平越高,源节点的路径就越重要。因此,位于源自高渗流节点的最短路径上的节点可能对渗流更为重要。PC 的定义也可以扩展到包括目标节点的权值。当采用Brandes的快速算法计算 Percolation centrality渗滤中心性时,计算时间复杂度为 [math]\displaystyle{ O(NM) }[/math],如果计算需要考虑目标节点的权值,最高的计算时间复杂度为 [math]\displaystyle{ O(N^3) }[/math] 。
算法
计算一个图中所有顶点的介数和紧密中心性Closeness centralities涉及到计算图中所有节点对之间的最短路径,使用 Floyd-Warshall 算法时,这需要big theta|[math]\displaystyle{ \Theta(|V|^3) }[/math]的时间复杂度,改进后的算法不仅可以找到一条路径,还可以计算两个节点之间的所有最短路径。在稀疏图上,Johnson算法或Brandes算法可能更有效率,两者的时间复杂度为Big O notation|[math]\displaystyle{ O(|V|^2 \log |V| + |V| |E|) }[/math]。在未加权图上,使用 Brandes 算法计算 介数中心性Betweenness centrality需要的时间复杂度为Big O notation|[math]\displaystyle{ O(|V| |E|) }[/math]。
在计算一个图的所有节点的介数和紧密中心性Closeness centralities时,假定图是无向的,并且图在允许自环和多边时是连通的。当专门处理网络图时,图通常没有自环或多边来维持简单的关系(其中的边表示两个人或节点之间的联系)。在这种情况下,使用 Brandes 算法将最终的中心性除以2,因为每条最短路径被计算两次。
另一个算法通过引入一个超参数来控制勘探和开发之间的平衡,将计算测地线的弗里曼(Freeman)介数和所有路径上计算纽曼(Newman)介数的结果进行了推广。时间复杂度是图中的边数乘以节点数。
中心性的概念也扩展到了群体层次。群体介数中心性反映了通过一组节点连接非组成员节点对的测地线所占的比例。修改了计算所有节点之间的介数中心性的Brandes算法,以计算具有相同渐近运行时间的一组节点之间的群体介数中心性。
相关概念
介数中心性Betweenness centrality 与网络的连通性有关,如果高介数顶点被移除,就有可能断开图的连接(参见割集)。
另请参阅
备注
- ↑ K.-I. Goh, B. Kahng, and D. Kim PhysRevLett.87.278701
- ↑ M. Barthélemy. Betweenness centrality in large complex networks. Eur. Phys. J. B 38, 163–168 (2004)
- ↑ Kwang-Il Goh, Eulsik Oh, Hawoong Jeong, Byungnam Kahng, and Doochul Kim. Classification of scale-free networks. PNAS (2002) vol. 99 no. 2
- ↑ A. Barrat, M. Barthelemy, R. Pastor-Satorras, and A. Vespignani. The architecture of complex weighted networks. PNAS (2004) vol. 101 no. 11
- ↑ Piraveenan, Mahendra (2013). "Percolation Centrality: Quantifying Graph-Theoretic Impact of Nodes during Percolation in Networks". PLOS ONE. 8 (1): e53095. Bibcode:2013PLoSO...853095P. doi:10.1371/journal.pone.0053095. PMC 3551907. PMID 23349699.
参考文献
- Brandes, Ulrik (2001). "A faster algorithm for betweenness centrality" (PDF). Journal of Mathematical Sociology. 25 (2): 163–177. CiteSeerX 10.1.1.11.2024. doi:10.1080/0022250x.2001.9990249. Archived from the original (PDF) on 2017-10-13. Retrieved 2018-11-18.
{{cite journal}}: Invalid|ref=harv(help)
- Freeman, Linton (1977). "A set of measures of centrality based on betweenness". Sociometry. 40 (1): 35–41. doi:10.2307/3033543. JSTOR 3033543.
{{cite journal}}: Invalid|ref=harv(help) - Goh, K. I.; Kahng, B.; Kim, D. (2001). "Universal Behavior of Load Distribution in Scale-Free Networks". Physical Review Letters. 87 (27): 278701. arXiv:cond-mat/0106565. Bibcode:2001PhRvL..87A8701G. doi:10.1103/physrevlett.87.278701.
{{cite journal}}: Invalid|ref=harv(help) - Mantrach, Amin; et al. (2010). "The sum-over-paths covariance kernel: A novel covariance measure between nodes of a directed graph". IEEE Transactions on Pattern Analysis and Machine Intelligence. 32 (6): 1112–1126. doi:10.1109/tpami.2009.78.
{{cite journal}}: Invalid|ref=harv(help) - Moxley, Robert L.; Moxley, Nancy F. (1974). "Determining Point-Centrality in Uncontrived Social Networks". Sociometry. 37 (1): 122–130. doi:10.2307/2786472. JSTOR 2786472.
{{cite journal}}: Invalid|ref=harv(help) - Newman, M. E. J. (2010). Networks: An Introduction. Oxford, UK: Oxford University Press. ISBN 978-0199206650.
- Dolev, Shlomi; Elovici, Yuval; Puzis, Rami (2010). "Routing betweenness centrality". J. ACM. 57 (4): 25:1–25:27. doi:10.1145/1734213.1734219.
编者推荐
集智课程推荐
本系列课程为图网络论文解读活动“算法原理探究”篇。
本期课程将围绕网络动力学这一前沿的方向,帮助大家构建网络科学学习体系。
