手写数字的识别
跳到导航
跳到搜索
数据准备
我们的任务是使用一堆手写数字图像的训练集训练出一个机器学习模型,然后根据这个模型去自动识别新的手写字体。
我们先使用sklearn包自带的手写数字训练数据:
    import matplotlib.pyplot as plt
    # Import datasets, classifiers and performance metrics
    from sklearn import datasets, svm, metrics
    # The digits dataset
    digits = datasets.load_digits()
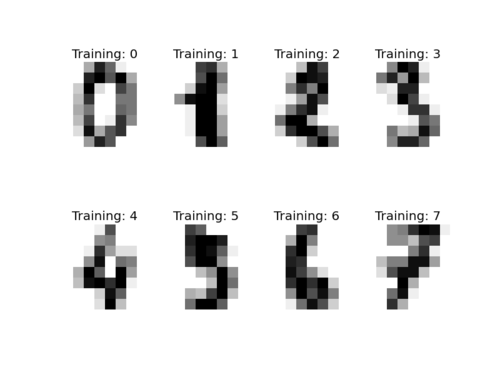
在这个数据集中,每个手写数字的图像被储存成一个8 x 8的矩阵,一共有1797个矩阵。我们可以将这些矩阵画出一些来感受一下我们要处理的数据
    for index, (image, label) in enumerate(zip(digits.images, digits.target)[:8]):
        plt.subplot(2, 4, index + 1)
        plt.axis('off')
        plt.imshow(image, cmap=plt.cm.gray_r, interpolation='nearest')
        plt.title('Training: %i' % label)
如下图所示:
训练一个SVM模型
因为数字一共有10种可能,所以其实这里的问题就是一个对图像进行分类的问题。我们选择支持向量机(support vector mechain,SVM)作为训练的模型。使用一半的数据集训练完后,再根据这个模型对另外一半的数据进行预测。
    n_samples = len(digits.images)
    data = digits.images.reshape((n_samples, -1))
    # Create a classifier: a support vector classifier
    classifier = svm.SVC(gamma=0.001)
    # We learn the digits on the first half of the digits
    classifier.fit(data[:n_samples / 2], digits.target[:n_samples / 2])
    # Now predict the value of the digit on the second half:
    expected = digits.target[n_samples / 2:]
    predicted = classifier.predict(data[n_samples / 2:])
分析模型的表现
使用
print (metrics.classification_report(expected, predicted))
打印出模型的预测结果:
            precision    recall  f1-score   support
         0       1.00      0.99      0.99        88
         1       0.99      0.97      0.98        91
         2       0.99      0.99      0.99        86
         3       0.98      0.87      0.92        91
         4       0.99      0.96      0.97        92
         5       0.95      0.97      0.96        91
         6       0.99      0.99      0.99        91
         7       0.96      0.99      0.97        89
         8       0.94      1.00      0.97        88
         9       0.93      0.98      0.95        92
avg / total 0.97 0.97 0.97 899
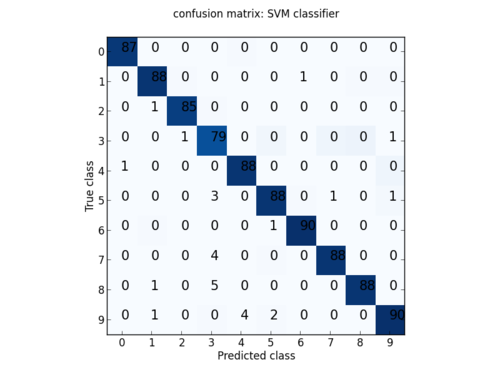
或者,我们也可以构造confusion matrix来仔细分析对每一类的判别情况:
    cm= metrics.confusion_matrix(expected, predicted)
    def plotCM(cm,title,colorbarOn,groupnames):
        ncm=cm/cm.max()
        plt.matshow(ncm, fignum=False, cmap='Blues', vmin=0, vmax=1.0)
        ax=plt.axes()
        ax.set_xticks(range(len(groupnames)))
        ax.set_xticklabels(groupnames)
        ax.xaxis.set_ticks_position("bottom")
        ax.set_yticks(range(len(groupnames)))
        ax.set_yticklabels(groupnames)
        plt.title(title,size=12)
        if colorbarOn=="on":
            plt.colorbar()
        plt.xlabel('Predicted class')
        plt.ylabel('True class')
        for i in range(cm.shape[0]):
            for j in range(cm.shape[1]):
                text(i,j,cm[i,j],size=15)
    plotCM(cm,"confusion matrix: SVM classifier","off",range(10))
如下图所示:
我们还可以找一些case,看看模型的结果与我们的感知是否一致:
    for index, (image, prediction) in enumerate(
        zip(digits.images[n_samples / 2:], predicted)[:8]):
        plt.subplot(2, 4, index + 1)
        plt.axis('off')
        plt.imshow(image, cmap=plt.cm.gray_r, interpolation='nearest')
        plt.title('Prediction: %i' % prediction)
如下图所示:
实际上,对于这八个数字,预测的结果(predicted[:8])和实际的结果(expected[:8])是完全一致的,都是[8, 8, 4, 9, 0, 8, 9, 8]。综合以上各项分析,SVM处理这种简单的图像处理问题还是非常拿手的。


