“系统动力学 System dynamics”的版本间的差异
(→存量-流量图) |
(→存量-流量图) |
||
| 第73行: | 第73行: | ||
在我们的示例中,有两种股票: 潜在的采用者和采用者。只有一种流动: 新的采用者。对于每一个新的采用者,潜在采用者的数量减少了一个,而采用者的数量增加了一个。 | 在我们的示例中,有两种股票: 潜在的采用者和采用者。只有一种流动: 新的采用者。对于每一个新的采用者,潜在采用者的数量减少了一个,而采用者的数量增加了一个。 | ||
| − | [[Image:Adoption | + | [[Image:Adoption SFD1.png|centre|''新产品采用''模型的存量-流量|frame]] |
===方程式 Equations=== | ===方程式 Equations=== | ||
2020年9月1日 (二) 16:58的版本
系统动力学 System Dynamics,SD是利用存量、流量、内部反馈回路、表函数和时滞等信息来理解复杂系统随时间变化的非线性行为的一种方法。[1][2]
概览
系统动力学是构建、理解和讨论复杂问题的一种方法论和数学建模技术。这一领域最初是在20世纪50年代发展起来的,目的是帮助企业管理者提高对工业过程的理解,现在被公共和私营部门用于政策分析和设计问题上。[3]
20世纪90年代推出了更方便用户使用的版本——具有图形用户界面 GUI系统动力学软件,并应用于各种系统。SD模型通过以小时间增量更新所有变量,用正反馈和负反馈以及时间延迟来构造交互和控制,从而解决了同时性(互为因果)的问题。最著名的SD模型可能是1972年的”增长极限“模型。该模型预测,随着人口和资本的指数增长,在有限的资源和汇以及感知延迟的情况下,将导致21世纪各种增长情景下的经济崩溃。
系统动力学是系统理论的一个方面,是理解复杂系统动态行为的一种方法。该方法的基础是认识到,任何系统的结构,其组成部分之间的许多循环的、互锁的、有时是时间延迟的关系,在决定其行为方面往往与单个组件本身一样重要。例如混沌理论和社会动力学。它还声称,由于在元素的属性中往往存在无法找到的整体属性,在某些情况下,整体的行为不能用部分的行为来解释。
历史 History
系统动力学是在20世纪50年代中期由麻省理工学院的 Jay Forrester 教授创立的。[4] 1956年,Forrester 接受了新成立的 MIT斯隆管理学院授予的教授职位。他最初的目标是确定如何利用他在科学和工程方面的背景,以某种有用的方式,在决定企业成败的核心问题上发挥作用。Jay Forrester 对工程学背后的共同基础的洞察,导致了系统动力学的产生,在很大程度上,是由于他在20世纪50年代中期与通用电气 General Electric,GE的经理们的合作而触发的。当时,通用电气的经理们感到困惑,因为很明显肯塔基州电器厂的就业周期为三年。商业周期被认为不足以解释就业的不稳定性。通过手工模拟(或计算)通用电气工厂的股票流量反馈结构,包括现有的企业决策结构的雇用和裁员,Forrester 能够显示通用电气就业的不稳定性是由于公司的内部结构,而不是由于商业周期等外部力量。这些手工仿真是系统动力学领域的开端。[3]
在20世纪50年代末和60年代初,Forrester 和一个研究生团队将系统动力学的新兴领域从手工仿真阶段转移到正式的计算机建模阶段。1958年春天,Richard Bennett 创造了第一个用于系统动力学建模的计算机语言,叫做 SIMPLE (用大量方程模拟工业管理问题)。1959年,菲利斯 · 福克斯和亚历山大 · 普撰写了第一个版本的Dynamo 。DYNAmic MOdels是 SIMPLE 的改进版本,系统动力学语言成为行业标准已有三十多年。1961年,弗雷斯特出版了第一本书《工业动力学》,该书至今仍然是经典的著作。
从1950年代后期到1960年代后期,系统动力学几乎完全适用于公司 / 管理问题。然而,在1968年,一个意想不到的事件使这个领域的范围扩大到公司模型之外。波士顿前市长约翰 · f · 柯林斯被任命为麻省理工学院城市事务的客座教授。柯林斯-福斯特合作的成果是出版了一本名为《城市动力学》的书。本书中提出的城市动力学模型是系统动力学的第一个主要的非企业应用。[3]
系统动力学的第一个非公司领域的应用出现之后,紧随其后出现了第二个主要的非公司应用。1970年,Jay Forrester 应罗马俱乐部的邀请参加了在瑞士伯尔尼举行的一次会议。罗马俱乐部是一个致力于解决其成员所描述的”人类困境”的组织,即今后某个时候可能出现的全球危机,因为世界人口呈指数增长,对地球的承载能力(可再生和不可再生资源的来源及其处理污染物的汇)提出了要求。在伯尔尼会议上,Forrester 被问及是否可以用系统动力学来解决人类的困境。当然,他的回答是可以。在从伯尔尼会议回来的飞机上,弗雷斯特创建了世界社会经济系统系统动力学模型的初稿。他把这个模型叫做 WORLD1。回到美国后,弗雷斯特精炼了 WORLD1,为罗马俱乐部成员访问麻省理工学院做准备,称这个模型为 WORLD2的改进版本,并在一本名为《世界动力学》的书中出版了 WORLD2。[3]
系统动力学主题 Topics in systems dynamics
The elements of system dynamics diagrams are feedback, accumulation of flows into stocks and time delays.
The elements of system dynamics diagrams are feedback, accumulation of flows into stocks and time delays.
系统动力学图的要素包括反馈、流到存量的累积和时间延迟。
As an illustration of the use of system dynamics, imagine an organisation that plans to introduce an innovative new durable consumer product. The organisation needs to understand the possible market dynamics in order to design marketing and production plans.
As an illustration of the use of system dynamics, imagine an organisation that plans to introduce an innovative new durable consumer product. The organisation needs to understand the possible market dynamics in order to design marketing and production plans.
作为系统动力学应用的一个例子,设想一个组织计划引入一种创新的耐用消费品。组织需要了解可能的市场动态,以便设计营销和生产计划。
因果循环图
在系统动力学方法论中,一个问题或一个系统(例如,生态系统、政治系统或机械系统)可以表示为一个环路图。环路图是一个系统的简单映射,包含了系统的所有组成部分及其相互作用。通过捕捉相互作用和随之而来的反馈回路(见下图) ,环路图揭示了一个系统的结构。通过了解一个系统的结构,就有可能确定一个系统在一定时间段内的行为。[5]
新产品介绍的环路图如下:

在这个图表中有两个反馈循环。右侧的正强化(标记为 R)循环表明,越多的人已经接受了新产品,口碑的影响就越强。将会有更多的产品参考,更多的演示和更多的评论。这种积极的反馈应该会产生持续增长的销售额。
左边的第二个反馈回路是负强化(或“平衡” ,因此标记为 B)。显然,增长不可能永远持续下去,因为随着越来越多的人采用,潜在的采用者越来越少。
两种反馈循环同时发挥作用,但在不同的时间,它们可能有不同的优势。因此,人们可能会认为,最初几年的销售额会增长,随后几年销售额会下降。然而,一般来说,环路图并没有充分指定系统的结构,以允许仅仅通过视觉表现来确定其行为。[6]
存量-流量图
因果循环图有助于将系统的结构和行为可视化,并对系统进行定性分析。为了进行更详细的定量分析,环路图被转换成存量-流量图。存量-流量模型有助于对系统进行定量研究和分析,这些模型通常是用计算机软件建立和模拟的。
存量是指随着时间的推移而累积或消耗的任何实体。流量是股票的变化率。

在我们的示例中,有两种股票: 潜在的采用者和采用者。只有一种流动: 新的采用者。对于每一个新的采用者,潜在采用者的数量减少了一个,而采用者的数量增加了一个。

方程式 Equations
The real power of system dynamics is utilised through simulation. Although it is possible to perform the modeling in a spreadsheet, there are a variety of software packages that have been optimised for this.
The real power of system dynamics is utilised through simulation. Although it is possible to perform the modeling in a spreadsheet, there are a variety of software packages that have been optimised for this.
通过仿真实现了系统动力学的真正威力。尽管在电子表格中执行建模是可能的,但是已经为此优化了各种软件包。
The steps involved in a simulation are:
The steps involved in a simulation are:
模拟涉及的步骤如下:
- Define the problem boundary 定义问题边界
- Identify the most important stocks and flows that change these stock levels 确定改变这些存量水平的最重要的存量和流量
- Identify sources of information that impact the flows 确定影响信息流的信息来源
- Identify the main feedback loops 确定主要反馈回路
- Draw a causal loop diagram that links the stocks, flows and sources of information 绘制一个因果循环图,将存量、流量和信息来源联系起来
- Write the equations that determine the flows 写出确定流量的方程式
- Estimate the parameters and initial conditions. These can be estimated using statistical methods, expert opinion, market research data or other relevant sources of information. 估计参数和初始条件。这些可以使用统计方法、专家意见、市场研究数据或其他相关信息来源进行估计。
- Simulate the model and analyse results. 对模型进行仿真分析。
In this example, the equations that change the two stocks via the flow are:
In this example, the equations that change the two stocks via the flow are:
在这个例子中,通过流量改变两种股票的方程是:
[math]\displaystyle{ \ \mbox{Potential adopters} = \int_{0} ^{t} \mbox{-New adopters }\,dt }[/math]
[math]\displaystyle{ \ \mbox{Potential adopters} = \int_{0} ^{t} \mbox{-New adopters }\,dt }[/math]
数学{潜在采纳者} int {0}{ t } mbox {-New adopters } ,dt / math
<! -- 我不想标记这个巨大的贡献,但是这难道不应该像 t (0)-sum (t (i))的潜在采用者那样吗?是的
[math]\displaystyle{ \ \mbox{Adopters} = \int_{0} ^{t} \mbox{New adopters }\,dt }[/math]
[math]\displaystyle{ \ \mbox{Adopters} = \int_{0} ^{t} \mbox{New adopters }\,dt }[/math]
数学{ Adopters } int {0}{ t } mbox { New Adopters } ,dt / math
离散时间方程 Equations in discrete time
List of all the equations in discrete time, in their order of execution in each year, for years 1 to 15 :
List of all the equations in discrete time, in their order of execution in each year, for years 1 to 15 :
离散时间内所有方程式的列表,按每年执行的次序,从第1年到第15年:
[math]\displaystyle{ 1) \ \mbox{Probability that contact has not yet adopted}=\mbox{Potential adopters} / (\mbox{Potential adopters } + \mbox{ Adopters}) }[/math]
[math]\displaystyle{ 1) \ \mbox{Probability that contact has not yet adopted}=\mbox{Potential adopters} / (\mbox{Potential adopters } + \mbox{ Adopters}) }[/math]
Math 1) mbox { contact 尚未采用} mbox { Potential Adopters } / ( mbox { Potential Adopters } + mbox { Adopters }) / math
[math]\displaystyle{ 2) \ \mbox{Imitators}=q \cdot \mbox{Adopters} \cdot \mbox{Probability that contact has not yet adopted} }[/math]
[math]\displaystyle{ 2) \ \mbox{Imitators}=q \cdot \mbox{Adopters} \cdot \mbox{Probability that contact has not yet adopted} }[/math]
数学2) mbox { Imitators } q cdot mbox { Adopters } cdot mbox {概率,该联系人尚未采用} / math
[math]\displaystyle{ 3) \ \mbox{Innovators}=p \cdot \mbox{Potential adopters} }[/math]
[math]\displaystyle{ 3) \ \mbox{Innovators}=p \cdot \mbox{Potential adopters} }[/math]
数学3) mbox { Innovators } p cdot mbox { Potential adopters } / math
[math]\displaystyle{ 4) \ \mbox{New adopters}=\mbox{Innovators}+\mbox{Imitators} }[/math]
[math]\displaystyle{ 4) \ \mbox{New adopters}=\mbox{Innovators}+\mbox{Imitators} }[/math]
数学4) mbox { New adopters } mbox { Innovators } + mbox { Imitators } / math
[math]\displaystyle{ 4.1) \ \mbox{Potential adopters}\ -= \mbox{New adopters } }[/math]
[math]\displaystyle{ 4.1) \ \mbox{Potential adopters}\ -= \mbox{New adopters } }[/math]
4.1) mbox { Potential adopters } - mbox { New adopters } / math
[math]\displaystyle{ 4.2) \ \mbox{Adopters}\ += \mbox{New adopters } }[/math]
[math]\displaystyle{ 4.2) \ \mbox{Adopters}\ += \mbox{New adopters } }[/math]
4.2) mbox { Adopters } mbox { New Adopters } / math
[math]\displaystyle{ \ p=0.03 }[/math]
[math]\displaystyle{ \ p=0.03 }[/math]
数学0.03 / 数学
[math]\displaystyle{ \ q=0.4 }[/math]
[math]\displaystyle{ \ q=0.4 }[/math]
数学0.4 / 数学
动态模拟结果 Dynamic simulation results
The dynamic simulation results show that the behaviour of the system would be to have growth in adopters that follows a classic s-curve shape.
The dynamic simulation results show that the behaviour of the system would be to have growth in adopters that follows a classic s-curve shape.
动态仿真结果表明,系统的行为将有增长的采纳者遵循一个经典的 s 曲线形状。 Br /
The increase in adopters is very slow initially, then exponential growth for a period, followed ultimately by saturation.
The increase in adopters is very slow initially, then exponential growth for a period, followed ultimately by saturation.
使用者的增长在一开始是非常缓慢的,然后是一段指数增长,最后是饱和。

frame
框架

frame
框架
连续时间方程 Equations in continuous time
To get intermediate values and better accuracy, the model can run in continuous time: we multiply the number of units of time and we proportionally divide values that change stock levels. In this example we multiply the 15 years by 4 to obtain 60 trimesters, and we divide the value of the flow by 4.
To get intermediate values and better accuracy, the model can run in continuous time: we multiply the number of units of time and we proportionally divide values that change stock levels. In this example we multiply the 15 years by 4 to obtain 60 trimesters, and we divide the value of the flow by 4.
为了得到中间值和更好的准确性,该模型可以在连续时间内运行: 我们乘以时间单位的数量,并按比例除以改变存量水平的值。在这个例子中,我们把15年乘以4得到60个三个月,然后我们把流量的值除以4。 Br
Dividing the value is the simplest with the Euler method, but other methods could be employed instead, such as Runge–Kutta methods.
Dividing the value is the simplest with the Euler method, but other methods could be employed instead, such as Runge–Kutta methods.
用欧拉法除值是最简单的方法,但也可以用其他方法代替,如龙格-库塔法。
List of the equations in continuous time for trimesters = 1 to 60 :
List of the equations in continuous time for trimesters = 1 to 60 :
连续时间方程列表1至60的三个月:
- They are the same equations as in the section Equation in discrete time above, except equations 4.1 and 4.2 replaced by following :
[math]\displaystyle{ 10) \ \mbox{Valve New adopters}\ = \mbox{New adopters} \cdot TimeStep }[/math]
[math]\displaystyle{ 10) \ \mbox{Valve New adopters}\ = \mbox{New adopters} \cdot TimeStep }[/math]
10) mbox { Valve New adopters } mbox { New adopters } cdot TimeStep / math
[math]\displaystyle{ 10.1) \ \mbox{Potential adopters}\ -= \mbox{Valve New adopters} }[/math]
[math]\displaystyle{ 10.1) \ \mbox{Potential adopters}\ -= \mbox{Valve New adopters} }[/math]
数学10.1) mbox { Potential adopters } - mbox { Valve New adopters } / math
[math]\displaystyle{ 10.2) \ \mbox{Adopters}\ += \mbox{Valve New adopters } }[/math]
[math]\displaystyle{ 10.2) \ \mbox{Adopters}\ += \mbox{Valve New adopters } }[/math]
10.2) mbox { Adopters } mbox { Valve New Adopters } / math
[math]\displaystyle{ \ TimeStep = 1/4 }[/math]
[math]\displaystyle{ \ TimeStep = 1/4 }[/math]
数学 time step 1 / 4 / math
- In the below stock and flow diagram, the intermediate flow 'Valve New adopters' calculates the equation :
[math]\displaystyle{ \ \mbox{Valve New adopters}\ = \mbox{New adopters } \cdot TimeStep }[/math]
[math]\displaystyle{ \ \mbox{Valve New adopters}\ = \mbox{New adopters } \cdot TimeStep }[/math]
{ Valve New adopters } mbox { New adopters } cdot TimeStep / math

frame
框架
应用 Application
System dynamics has found application in a wide range of areas, for example population, agriculture[8], ecological and economic systems, which usually interact strongly with each other.
System dynamics has found application in a wide range of areas, for example population, agriculture, ecological and economic systems, which usually interact strongly with each other.
系统动力学在人口、农业、生态和经济系统等各个领域都有着广泛的应用,这些领域之间往往存在着强烈的相互作用。
System dynamics have various "back of the envelope" management applications. They are a potent tool to:
System dynamics have various "back of the envelope" management applications. They are a potent tool to:
系统动力学有各种各样的“封底”管理应用。它们是一个强有力的工具:
- Teach system thinking reflexes to persons being coached 向受训者传授系统思维反射
- Analyze and compare assumptions and mental models about the way things work 分析和比较关于事物运作方式的假设和心智模型 Mental model
- Gain qualitative insight into the workings of a system or the consequences of a decision 对一个系统的运作或决策的结果获得定性的洞察
- Recognize archetypes of dysfunctional systems in everyday practice 在日常实践中认识功能失调系统的原型
Computer software is used to simulate a system dynamics model of the situation being studied. Running "what if" simulations to test certain policies on such a model can greatly aid in understanding how the system changes over time. System dynamics is very similar to systems thinking and constructs the same causal loop diagrams of systems with feedback. However, system dynamics typically goes further and utilises simulation to study the behaviour of systems and the impact of alternative policies.[9]
Computer software is used to simulate a system dynamics model of the situation being studied. Running "what if" simulations to test certain policies on such a model can greatly aid in understanding how the system changes over time. System dynamics is very similar to systems thinking and constructs the same causal loop diagrams of systems with feedback. However, system dynamics typically goes further and utilises simulation to study the behaviour of systems and the impact of alternative policies.
用计算机软件对所研究的情况进行了系统动力学模型的仿真。在这样的模型上运行“如果”模拟来测试某些策略可以极大地帮助理解随着时间的推移系统如何变化。系统动力学与系统思维非常相似,构造了具有反馈的系统相同的因果循环图。然而,系统动力学通常走得更远,利用模拟来研究系统的行为和替代政策的影响。
System dynamics has been used to investigate resource dependencies, and resulting problems, in product development.[10][11]
System dynamics has been used to investigate resource dependencies, and resulting problems, in product development.
系统动力学已经被用来研究产品开发中的资源依赖,以及由此产生的问题。
A system dynamics approach to macroeconomics, known as Minsky, has been developed by the economist Steve Keen.[12] This has been used to successfully model world economic behaviour from the apparent stability of the Great Moderation to the sudden unexpected Financial crisis of 2007–08.
A system dynamics approach to macroeconomics, known as Minsky, has been developed by the economist Steve Keen. This has been used to successfully model world economic behaviour from the apparent stability of the Great Moderation to the sudden unexpected Financial crisis of 2007–08.
经济学家史蒂夫•基恩(Steve Keen)提出了一种宏观经济学的系统动力学方法——明斯基(Minsky)。从“大缓和”(Great Moderation)时期表面上的稳定,到2007年至2008年突如其来的金融危机,世界经济行为都成功地运用了这一模型。
例子 Example

Causal loop diagram of a model examining the growth or decline of a life insurance company.
人寿保险公司的增长或衰退模型的环路图。
The figure above is a causal loop diagram of a system dynamics model created to examine forces that may be responsible for the growth or decline of life insurance companies in the United Kingdom. A number of this figure's features are worth mentioning. The first is that the model's negative feedback loops are identified by C's, which stand for Counteracting loops. The second is that double slashes are used to indicate places where there is a significant delay between causes (i.e., variables at the tails of arrows) and effects (i.e., variables at the heads of arrows). This is a common causal loop diagramming convention in system dynamics. Third, is that thicker lines are used to identify the feedback loops and links that author wishes the audience to focus on. This is also a common system dynamics diagramming convention. Last, it is clear that a decision maker would find it impossible to think through the dynamic behavior inherent in the model, from inspection of the figure alone.[13]
The figure above is a causal loop diagram of a system dynamics model created to examine forces that may be responsible for the growth or decline of life insurance companies in the United Kingdom. A number of this figure's features are worth mentioning. The first is that the model's negative feedback loops are identified by C's, which stand for Counteracting loops. The second is that double slashes are used to indicate places where there is a significant delay between causes (i.e., variables at the tails of arrows) and effects (i.e., variables at the heads of arrows). This is a common causal loop diagramming convention in system dynamics. Third, is that thicker lines are used to identify the feedback loops and links that author wishes the audience to focus on. This is also a common system dynamics diagramming convention. Last, it is clear that a decision maker would find it impossible to think through the dynamic behavior inherent in the model, from inspection of the figure alone.
上面的数字是一个系统动力学模型的环路图,这个模型是为了研究可能对英国寿险公司的增长或衰退负有责任的力量而创建的。这个数字的一些特征值得一提。首先,模型的负反馈回路由 c 进行识别,c 代表抵消回路。第二种是双斜线用来表示原因(即箭头尾部的变量)和效果(即箭头头部的变量)之间存在显著延迟的地方。这是系统动力学中常见的因果循环图。第三,较粗的线条用来识别作者希望读者关注的反馈回路和链接。这也是一个常见的系统动力学图表惯例。最后,很明显,决策者不可能仅仅通过对数字的检查来思考模型中固有的动态行为。
活塞运动实例 Example of piston motion
- Objective: study of a crank-connecting rod system.
We want to model a crank-connecting rod system through a system dynamic model. Two different full descriptions of the physical system with related systems of equations can be found here 模板:In lang and here 模板:In lang; they give the same results. In this example, the crank, with variable radius and angular frequency, will drive a piston with a variable connecting rod length.
Objective: study of a crank-connecting rod system.
 We want to model a crank-connecting rod system through a system dynamic model. Two different full descriptions of the physical system with related systems of equations can be found  here  and here ; they give the same results. In this example, the crank, with variable radius and angular frequency, will drive a piston with a variable connecting rod length.
目的: 研究曲柄连杆机构。 通过建立系统动力学模型,对曲柄连杆机构进行建模。在这里可以找到对物理系统和相关方程组的两种不同的完整描述,它们给出了相同的结果。在这个例子中,可变半径和角频率的曲柄将驱动连杆长度可变的活塞。
- System dynamic modeling: the system is now modeled, according to a stock and flow system dynamic logic.
The figure below shows the stock and flow diagram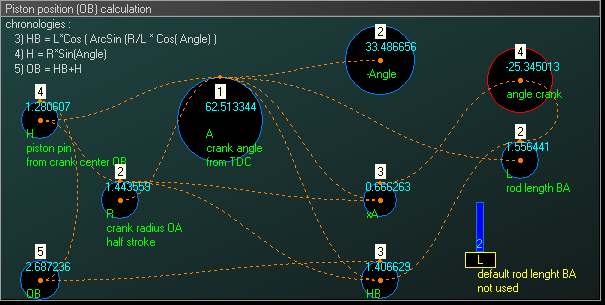 Stock and flow diagram for crank-connecting rod system 曲柄连杆系统的存量流量图

System dynamic modeling: the system is now modeled, according to a stock and flow system dynamic logic.
 The figure below shows the stock and flow diagram frame
系统动态建模: 根据存量和流量系统的动态逻辑对系统进行建模。 Br / 下图显示了存量-流量图框架
- Simulation: the behavior of the crank-connecting rod dynamic system can then be simulated.
The next figure is a 3D simulation created using procedural animation. Variables of the model animate all parts of this animation: crank, radius, angular frequency, rod length, and piston position.
Simulation: the behavior of the crank-connecting rod dynamic system can then be simulated.
 The next figure is a 3D simulation created using procedural animation. Variables of the model animate all parts of this animation: crank, radius, angular frequency, rod length, and piston position.
仿真: 可以对曲柄连杆机构的动力学行为进行仿真。 Br / 下一个图形是使用过程动画创建的3D 模拟。模型的变量动画这个动画的所有部分: 曲柄,半径,角频率,连杆长度,和活塞的位置。

3D frame
三维动画[曲柄连杆机构的程序动画,2 | 帧]
See also
参见
- Related subjects
相关科目 Related subjects
- Causal loop diagram 因果循环图
- Comparison of system dynamics software 系统动力学软件比较
- Ecosystem model 生态系统模型
- Plateau Principle 高原原理
- System archetypes 系统原型
- System Dynamics Society 系统动力学学会
- Twelve leverage points 十二个杠杆点
- Wicked problems 邪恶的问题
- World3 世界3
- Population dynamics 人口动力学
- Predator-prey interaction 捕食-食饵相互作用
Related fields 相关领域
- Dynamical systems theory 动力系统理论
- Grey box model 灰盒模型
- Social dynamics 社会动力
- Systems theory 系统理论
- Systems thinking 系统思维
相关科学家 Related scientists
参考资料 References
- ↑ F. H. A. Rahim, N. N. Hawari and N. Z. Abidin, “Supply and demand of rice in Malaysia: A system dynamics approach”, International Journal of Supply Chain and Management, Vol.6, No.4, pp. 234-240, 2017.
- ↑ MIT System Dynamics in Education Project (SDEP)
- ↑ 3.0 3.1 3.2 3.3 Michael J. Radzicki and Robert A. Taylor (2008). "Origin of System Dynamics: Jay W. Forrester and the History of System Dynamics". In: U.S. Department of Energy's Introduction to System Dynamics. Retrieved 23 October 2008.
- ↑ Forrester, Jay (1971). Counterintuitive behavior of social systems. Technology Review 73(3): 52–68
- ↑ Meadows, Donella. (2008). Thinking in Systems: A Primer. Earthscan
- ↑ Richardson, G. P. (1986), Problems with causal-loop diagrams. Syst. Dyn. Rev., 2: 158–170. doi:10.1002/sdr.4260020207
- ↑ Sterman, John D. (2001). "System dynamics modeling: Tools for learning in a complex world 系统动力学建模:在复杂世界中学习的工具". California Management Review 加州管理评论. 43 (4): 8–25. doi:10.2307/41166098. JSTOR 41166098.
- ↑ F. H. A. Rahim, N. N. Hawari and N. Z. Abidin, “Supply and demand of rice in Malaysia: A system dynamics approach”, International Journal of Supply Chain and Management, Vol.6, No.4, pp. 234-240, 2017.
- ↑ System Dynamics Society
- ↑ Repenning, Nelson P. (2001). "Understanding fire fighting in new product development" (PDF). The Journal of Product Innovation Management. 18 (5): 285–300. doi:10.1016/S0737-6782(01)00099-6. hdl:1721.1/3961.
- ↑ Nelson P. Repenning (1999). Resource dependence in product development improvement efforts, MIT Sloan School of Management Department of Operations Management/System Dynamics Group, Dec 1999.
- ↑ [1] Minsky - Project of the month January 2014. Interview with Minsky development team. Accessed January 2014
- ↑ 13.0 13.1 Michael J. Radzicki and Robert A. Taylor (2008). "Feedback". In: U.S. Department of Energy's Introduction to System Dynamics. Retrieved 23 October 2008.
进一步阅读 Further reading
- Kypuros, Javier (2013). System dynamics and control with bond graph modeling 键合图建模的系统动力学与控制. Boca Raton: Taylor & Francis. ISBN 1466560754.
- Forrester, Jay W. (1961). Industrial Dynamics 产业动态. Pegasus Communications. ISBN 978-1-883823-36-8.
- Forrester, Jay W. (1969). Urban Dynamics 城市动态. Pegasus Communications. ISBN 978-1-883823-39-9.
- Meadows, Donella H. (1972). Limits to Growth 增长的限制. New York: University books. ISBN 978-0-87663-165-2.
- Morecroft, John (2007). Strategic Modelling and Business Dynamics: A Feedback Systems Approach 战略建模与业务动态:反馈系统方法. John Wiley & Sons. ISBN 978-0-470-01286-4.
- Roberts, Edward B. (1978). Managerial Applications of System Dynamics 系统动力学的管理应用. Cambridge: MIT Press. ISBN 978-0-262-18088-7. https://archive.org/details/managerialapplic0000unse.
- Randers, Jorgen (1980). Elements of the System Dynamics Method 系统动力学方法要素. Cambridge: MIT Press. ISBN 978-0-915299-39-3.
- Senge, Peter (1990). The Fifth Discipline 第五条纪律. Currency. ISBN 978-0-385-26095-4.
- Sterman, John D. (2000). Business Dynamics: Systems thinking and modeling for a complex world 业务动态:复杂世界的系统思考和建模. McGraw Hill. ISBN 978-0-07-231135-8.
外部链接 External links
- Desert Island Dynamics "An Annotated Survey of the Essential System Dynamics Literature"
Dynamics
动力学
Category:Operations research
类别: 运筹学
Category:Problem structuring methods
类别: 问题结构化方法
Category:Scientific modeling
类别: 科学建模
Dynamics
动力学
This page was moved from wikipedia:en:System dynamics. Its edit history can be viewed at 系统动力学/edithistory