流形学习
跳到导航
跳到搜索
简介
本质上,流形学习就是给数据降维的过程。这里假设数据是一个随机样本,采样自一个高维欧氏空间中的流形(manifold),流形学习的任务就是把这个高维流形映射到一个低维(例如2维)的空间里。流形学习可以分为线性算法和非线性算法,前者包括主成分分析(PCA)和线性判别分析(LDA),后者包括等距映射(Isomap),拉普拉斯特征映射(LE)等。流形学习可以用于特征的降维和提取,为后续的基于特征的分析,如聚类和分类,做铺垫,也可以直接应用于数据可视化等。
案例:球面映射
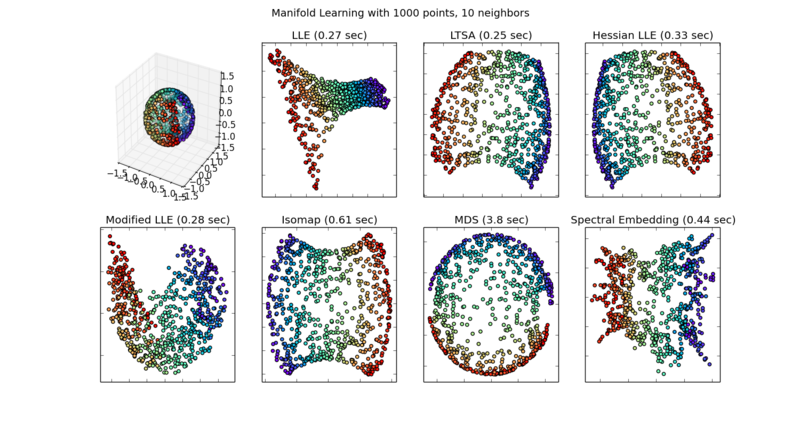
在本案例中,我们使用模拟数据制造一个球面,并将这个3维空间中的流形project到2维上。
调用包
    from time import time
    import numpy as np
    import pylab as pl
    from mpl_toolkits.mplot3d import Axes3D
    from matplotlib.ticker import NullFormatter
    from sklearn import manifold
    from sklearn.utils import check_random_state
制造一个三维球面的模拟数据
    # Variables for manifold learning.
    n_neighbors = 10
    n_samples = 1000
    # Create our sphere.
    random_state = check_random_state(0)
    p = random_state.rand(n_samples) * (2 * np.pi - 0.55)
    t = random_state.rand(n_samples) * np.pi
    # Sever the poles from the sphere.
    indices = ((t < (np.pi - (np.pi / 8))) & (t > ((np.pi / 8))))
    colors = p[indices]
    x, y, z = np.sin(t[indices]) * np.cos(p[indices]), \
        np.sin(t[indices]) * np.sin(p[indices]), \
        np.cos(t[indices])
    # Plot our dataset.
    fig = pl.figure(figsize=(15, 8))
    pl.suptitle("Manifold Learning with %i points, %i neighbors"
                % (1000, n_neighbors), fontsize=14)
    ax = fig.add_subplot(241, projection='3d')
    ax.scatter(x, y, z, c=p[indices], cmap=pl.cm.rainbow)
    plt.draw()
    sphere_data = np.array([x, y, z]).T
拟合线性的流形学习模型LLE, LTSA, Hessian LLE, 和Modified LLE
    # Perform Locally Linear Embedding Manifold learning
    methods = ['standard', 'ltsa', 'hessian', 'modified']
    labels = ['LLE', 'LTSA', 'Hessian LLE', 'Modified LLE']
    for i, method in enumerate(methods):
        t0 = time()
        trans_data = manifold\
            .LocallyLinearEmbedding(n_neighbors, 2,
                                    method=method).fit_transform(sphere_data).T
        t1 = time()
        print("%s: %.2g sec" % (methods[i], t1 - t0))
        ax = fig.add_subplot(242 + i)
        pl.scatter(trans_data[0], trans_data[1], c=colors, cmap=pl.cm.rainbow)
        pl.title("%s (%.2g sec)" % (labels[i], t1 - t0))
        ax.xaxis.set_major_formatter(NullFormatter())
        ax.yaxis.set_major_formatter(NullFormatter())
        pl.axis('tight')
拟合非线性的流形学习模型Isomap,MDS和Spectral Embedding
    # Perform Isomap Manifold learning.
    t0 = time()
    trans_data = manifold.Isomap(n_neighbors, n_components=2)\
        .fit_transform(sphere_data).T
    t1 = time()
    print("%s: %.2g sec" % ('ISO', t1 - t0))
    ax = fig.add_subplot(246)
    pl.scatter(trans_data[0], trans_data[1],  c=colors, cmap=pl.cm.rainbow)
    pl.title("%s (%.2g sec)" % ('Isomap', t1 - t0))
    ax.xaxis.set_major_formatter(NullFormatter())
    ax.yaxis.set_major_formatter(NullFormatter())
    pl.axis('tight')

    # Perform Multi-dimensional scaling.
    t0 = time()
    mds = manifold.MDS(2, max_iter=100, n_init=1)
    trans_data = mds.fit_transform(sphere_data).T
    t1 = time()
    print("MDS: %.2g sec" % (t1 - t0))
    ax = fig.add_subplot(247)
    pl.scatter(trans_data[0], trans_data[1],  c=colors, cmap=pl.cm.rainbow)
    pl.title("MDS (%.2g sec)" % (t1 - t0))
    ax.xaxis.set_major_formatter(NullFormatter())
    ax.yaxis.set_major_formatter(NullFormatter())
    pl.axis('tight')

    # Perform Spectral Embedding.
    t0 = time()
    se = manifold.SpectralEmbedding(n_components=2,n_neighbors=n_neighbors)
    trans_data = se.fit_transform(sphere_data).T
    t1 = time()
    print("Spectral Embedding: %.2g sec" % (t1 - t0))
    ax = fig.add_subplot(248)
    pl.scatter(trans_data[0], trans_data[1],  c=colors, cmap=pl.cm.rainbow)
    pl.title("Spectral Embedding (%.2g sec)" % (t1 - t0))
    ax.xaxis.set_major_formatter(NullFormatter())
    ax.yaxis.set_major_formatter(NullFormatter())
    pl.axis('tight')
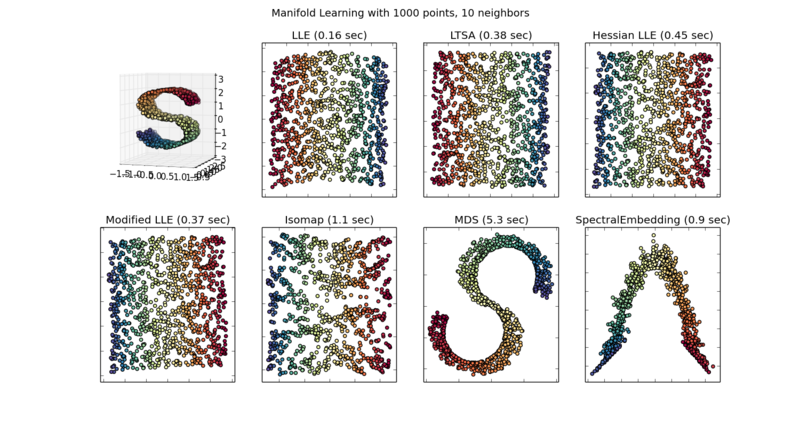
案例:S曲面映射
调用包
除了上一节的包以外还要调用:
    from matplotlib.ticker import NullFormatter
    from sklearn import manifold, datasets
制造一个三维空间中的S流形的模拟数据
    n_points = 1000
    X, color = datasets.samples_generator.make_s_curve(n_points, random_state=0)
    n_neighbors = 10
    n_components = 2
    fig = pl.figure(figsize=(15, 8))
    pl.suptitle("Manifold Learning with %i points, %i neighbors"
                % (1000, n_neighbors), fontsize=14)
    ax = fig.add_subplot(241, projection='3d')
    ax.scatter(X[:, 0], X[:, 1], X[:, 2], c=color, cmap=pl.cm.Spectral)
    plt.draw()
拟合各种流形学习模型
在制造完模拟数据后,剩下的各个拟合与上一节的代码基本一致,只有两个细节需要修改:
原来使用的拟合命令
    trans_data = mds.fit_transform(sphere_data).T
    pl.scatter(trans_data[0], trans_data[1],  c=colors, cmap=pl.cm.rainbow)
需要改成:
    trans_data = mds.fit_transform(X)
    pl.scatter(trans_data[:,0], trans_data[:,1],  c=color, cmap=pl.cm.Spectral)
案例:对手写数字的降维分析
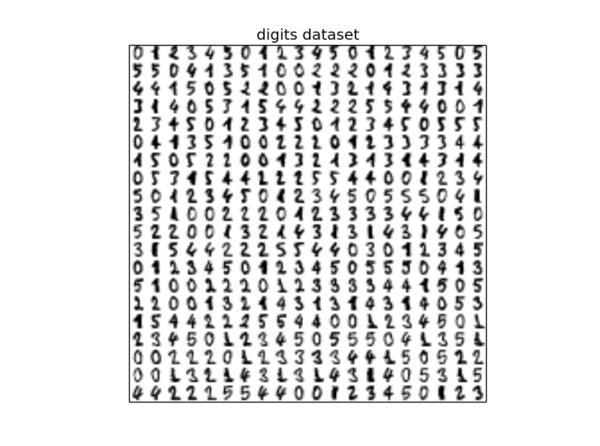
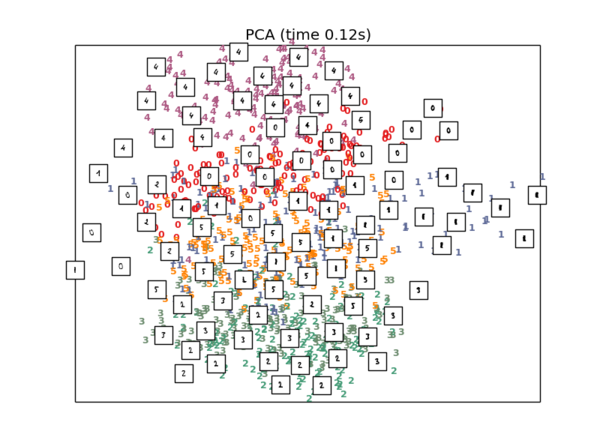
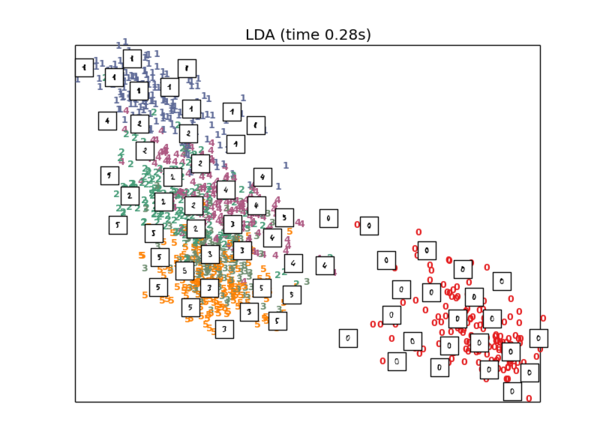
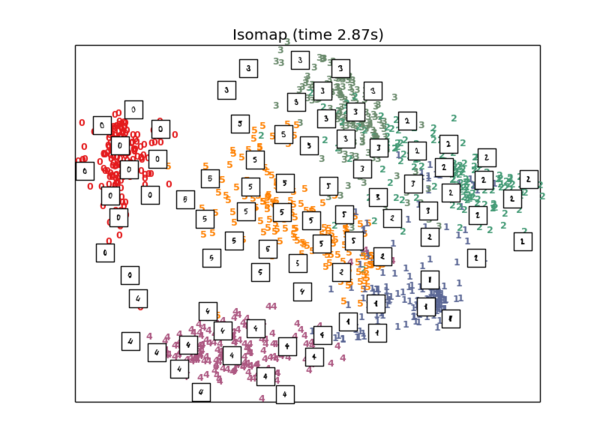
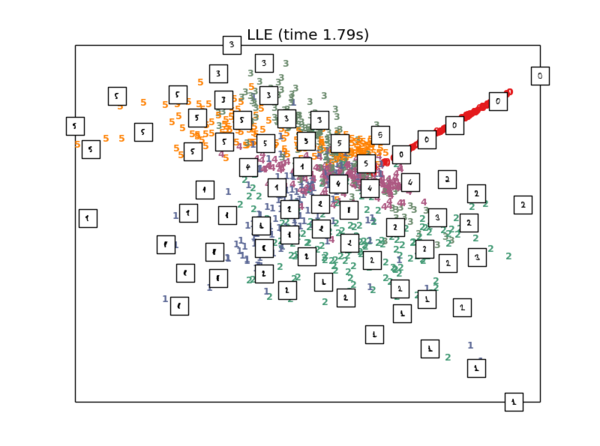
我们之前已经讨论过手写数字的数据,每个手写的阿拉伯数字被表达为一个8*8的像素矩阵,我们曾经使用每个像素点,也就是64个特征,使用logistic和knn的方法(分类器)去根据训练集判别测试集中的数字。在这种做法中,我们使用了尚未被降维的数据。其实我们还可以使用降维后的数据来训练分类器。现在,就让我们看一下对这个数据集采取各种方式降维的效果。
引用包和搜集待分析的数据
    from time import time
    import numpy as np
    import pylab as pl
    from matplotlib import offsetbox
    from sklearn import (manifold, datasets, decomposition, ensemble, lda,
                         random_projection)

    digits = datasets.load_digits(n_class=6)
    X = digits.data
    y = digits.target
    n_samples, n_features = X.shape
    n_neighbors = 30
    # Plot images of the digits
    n_img_per_row = 20
    img = np.zeros((10 * n_img_per_row, 10 * n_img_per_row))
    for i in range(n_img_per_row):
        ix = 10 * i + 1
        for j in range(n_img_per_row):
            iy = 10 * j + 1
            img[ix:ix + 8, iy:iy + 8] = X[i * n_img_per_row + j].reshape((8, 8))

    pl.imshow(img, cmap=pl.cm.binary)
    pl.xticks([])
    pl.yticks([])
    pl.title('digits dataset')
定义可视化函数
    # Scale and visualize the embedding vectors
    def plot_embedding(X, title=None):
        x_min, x_max = np.min(X, 0), np.max(X, 0)
        X = (X - x_min) / (x_max - x_min)
        pl.figure()
        ax = pl.subplot(111)
        for i in range(X.shape[0]):
            pl.text(X[i, 0], X[i, 1], str(digits.target[i]),
                    color=pl.cm.Set1(y[i] / 10.),
                    fontdict={'weight': 'bold', 'size': 9})
        if hasattr(offsetbox, 'AnnotationBbox'):
            # only print thumbnails with matplotlib > 1.0
            shown_images = np.array([[1., 1.]])  # just something big
            for i in range(digits.data.shape[0]):
                dist = np.sum((X[i] - shown_images) ** 2, 1)
                if np.min(dist) < 4e-3:
                    # don't show points that are too close
                    continue
                shown_images = np.r_[shown_images, [X[i]]]
                imagebox = offsetbox.AnnotationBbox(
                    offsetbox.OffsetImage(digits.images[i], cmap=pl.cm.gray_r),
                    X[i])
                ax.add_artist(imagebox)
        pl.xticks([]), pl.yticks([])
        if title is not None:
            pl.title(title)
接着,就可以观察比较各种降维方法的效果了:
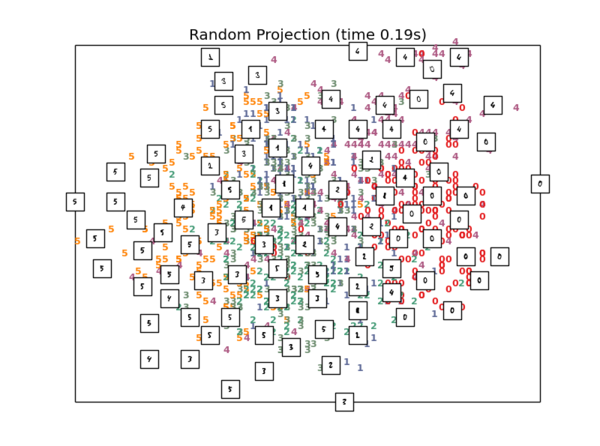
随机降维
把64维数据随机地投影到二维上
    #1.Random 2D projection using a random unitary matrix
    t0 = time()
    rp = random_projection.SparseRandomProjection(n_components=2, random_state=42)
    X_projected = rp.fit_transform(X)
    plot_embedding(X_projected, "Random Projection (time %.2fs)" % (time() - t0))
PCA降维
    #2.Projection on to the first 2 principal components
    t0 = time()
    X_pca = decomposition.TruncatedSVD(n_components=2).fit_transform(X)
    plot_embedding(X_pca, "PCA (time %.2fs)" % (time() - t0))
LDA降维
    #3.Projection on to the first 2 linear discriminant components
    X2 = X.copy()
    X2.flat[::X.shape[1] + 1] += 0.01  # Make X invertible
    t0 = time()
    X_lda = lda.LDA(n_components=2).fit_transform(X2, y)
    plot_embedding(X_lda,"LDA (time %.2fs)" % (time() - t0))
Isomap降维
    #4.Isomap projection of the digits dataset
    t0 = time()
    X_iso = manifold.Isomap(n_neighbors, n_components=2).fit_transform(X)
    plot_embedding(X_iso, "Isomap (time %.2fs)" %  (time() - t0))
LLE降维
    #4.Locally linear embedding of the digits dataset
    clf = manifold.LocallyLinearEmbedding(n_neighbors, n_components=2, method='standard')
    t0 = time()
    X_lle = clf.fit_transform(X)
    plot_embedding(X_lle, "LLE (time %.2fs)" %    (time() - t0))
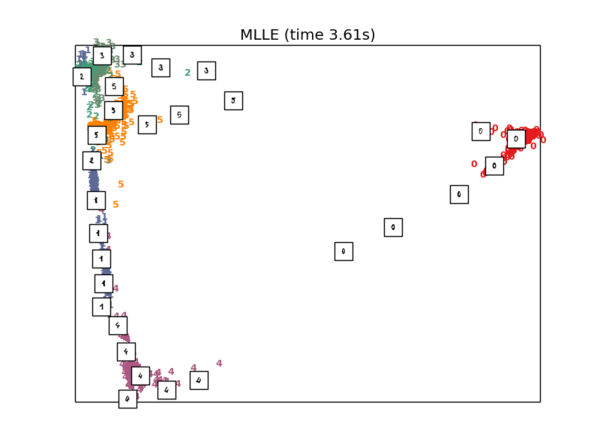
MLLE降维
    #5.Modified Locally linear embedding of the digits dataset
    clf = manifold.LocallyLinearEmbedding(n_neighbors, n_components=2, method='modified')
    t0 = time()
    X_mlle = clf.fit_transform(X)
    plot_embedding(X_mlle,  "MLLE (time %.2fs)" %   (time() - t0))
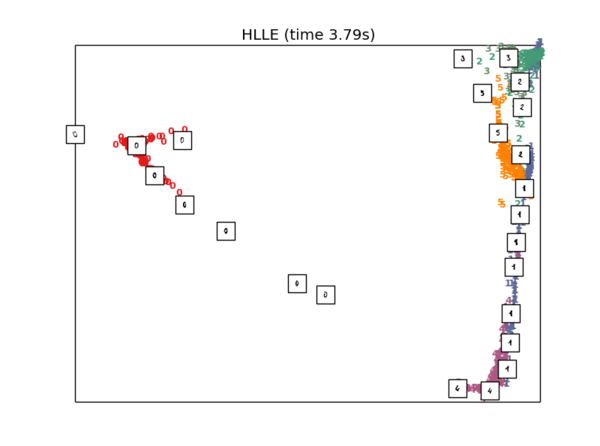
HLLE降维
    #6.HLLE embedding of the digits dataset
    clf = manifold.LocallyLinearEmbedding(n_neighbors, n_components=2, method='hessian')
    t0 = time()
    X_hlle = clf.fit_transform(X)
    plot_embedding(X_hlle,"HLLE (time %.2fs)" %   (time() - t0))
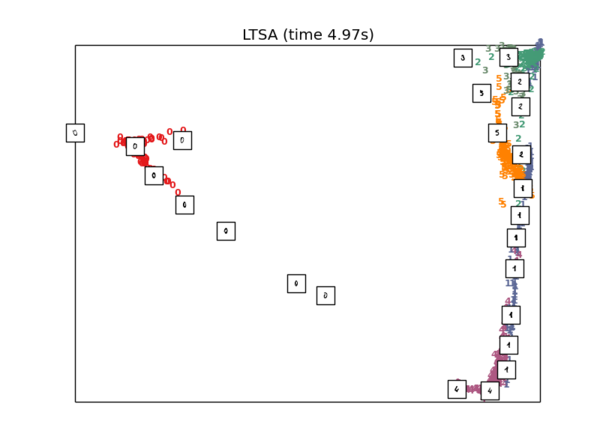
LTSA降维
    #7.LTSA embedding of the digits dataset
    clf = manifold.LocallyLinearEmbedding(n_neighbors, n_components=2, method='ltsa')
    t0 = time()
    X_ltsa = clf.fit_transform(X)
    plot_embedding(X_ltsa, "LTSA (time %.2fs)" % (time() - t0))
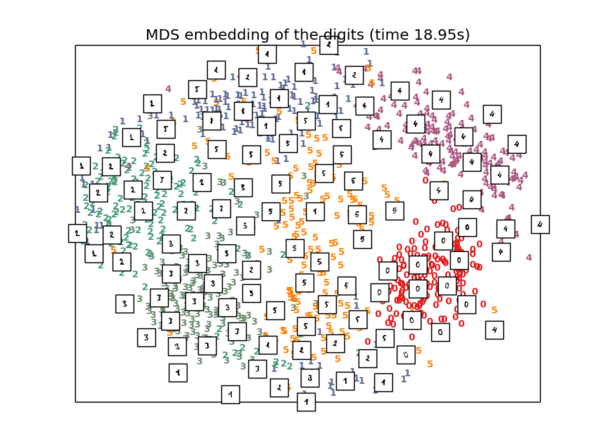
MDS降维
    #8.MDS  embedding of the digits dataset
    clf = manifold.MDS(n_components=2, n_init=1, max_iter=100)
    t0 = time()
    X_mds = clf.fit_transform(X)
    plot_embedding(X_mds, "MDS embedding of the digits (time %.2fs)" %   (time() - t0))
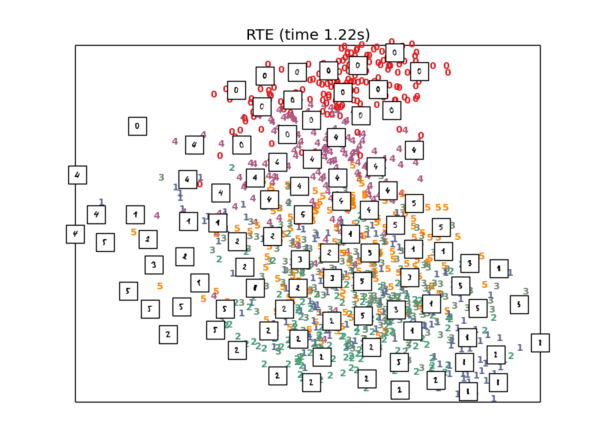
RTE降维
    #9. Random Trees embedding of the digits dataset
    hasher = ensemble.RandomTreesEmbedding(n_estimators=200, random_state=0,   max_depth=5)
    t0 = time()
    X_transformed = hasher.fit_transform(X)
    pca = decomposition.TruncatedSVD(n_components=2)
    X_reduced = pca.fit_transform(X_transformed)
    plot_embedding(X_reduced,  "RTE (time %.2fs)" %   (time() - t0))
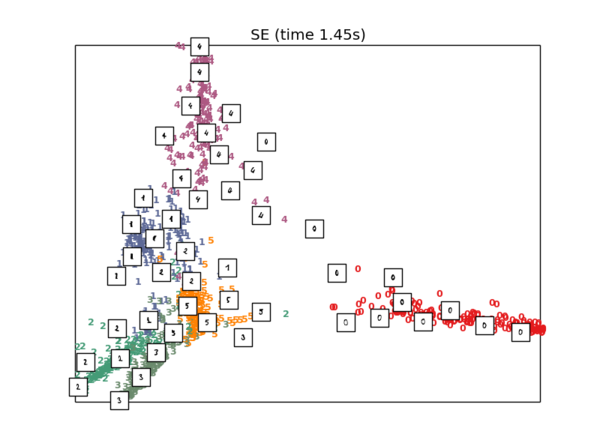
SE降维
    #10. Spectral embedding of the digits dataset
    embedder = manifold.SpectralEmbedding(n_components=2, random_state=0,  eigen_solver="arpack")
    t0 = time()
    X_se = embedder.fit_transform(X)
    plot_embedding(X_se,  "SE (time %.2fs)" % (time() - t0))
总结来说,非线性方法要比线性方法好一些。可以看出手写字体的图像特征是非线性的。
