Logistic映射
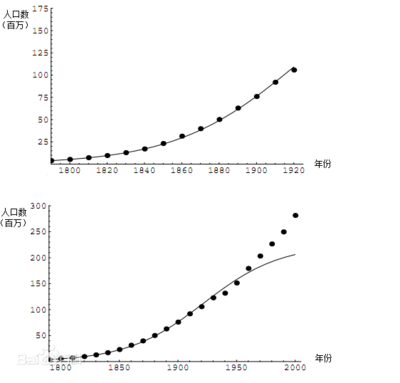
Logistic映射,又称单峰映象,是一个二次多项式映射(递归关系),经常作为典型范例来说明复杂的混沌现象是如何从非常简单的非线性动力学方程中产生的。生物学家罗伯特·梅 Robert May [1]在1976年的一篇论文中推广了这一映射,[2]它在一定程度上是一个时间离散的人口统计模型,类似于皮埃尔·弗朗索瓦·韦胡斯特 Pierre Francois Verhulst 首次提出的方程。
Logistic映射的数学表达式表示为:
- [math]\displaystyle{ x(t+1)=\mu x(t)(1-x(t)) }[/math]
其中,t为迭代时间步,对于任意的t,[math]\displaystyle{ x(t)\in [0,1] }[/math],[math]\displaystyle{ \mu }[/math]为一可调参数,为了保证映射得到的[math]\displaystyle{ x(t) }[/math]始终位于[0,1]内,则[math]\displaystyle{ \mu\in [0,4] }[/math]。[math]\displaystyle{ x(t) }[/math]为在t时刻种群占最大可能种群规模的比例(即现有人口数与最大可能人口数的比率)。当变化不同的参数[math]\displaystyle{ \mu }[/math]时,该方程会展现出不同的动力学极限行为(即当t趋于无穷大,[math]\displaystyle{ x(t) }[/math]的变化情况),包括:稳定点(即最终[math]\displaystyle{ x(t) }[/math]始终为同一个数值)、周期([math]\displaystyle{ x(t) }[/math]会在2个或者多个数值之间跳跃)、以及混沌([math]\displaystyle{ x(t) }[/math]的终态不会重复,而会等概率地取遍某区间)。
当[math]\displaystyle{ μ }[/math]超过[1,4]时,就会发生混沌现象。该非线性差分方程意在观察两种情形:
- 当人口规模很小时,人口将以与当前人口成比例的速度增长进行繁殖。
- 饥饿(与密度有关的死亡率) ,其增长率将以与环境的”承受能力”减去当前人口所得值成正比的速度下降
然而,Logistic映射作为一种人口统计模型,存在着一些初始条件和参数值(如[math]\displaystyle{ μ }[/math] >4)为某值时所导致的混沌问题。这个问题在较老的瑞克模型中没有出现,该模型也展示了混沌动力学。
该模型可以用来模拟生物种群的生长行为,所以Logistic映射也叫“虫口模型”。其中[math]\displaystyle{ x(t) }[/math]可以解释为在t时刻种群占最大可能种群规模的比例。我们将原方程变形为:
- [math]\displaystyle{ x(t+1)-x(t)=(\mu-1) x(t) - \mu x(t)^2 }[/math]
其中,[math]\displaystyle{ x(t+1)-x(t) }[/math]可以解释为种群的生长率(即一个单位周期内,种群数量的变化)。[math]\displaystyle{ (\mu-1) x(t) }[/math]可以解释为虫种群的出生,[math]\displaystyle{ \mu x(t)^2 }[/math]为种群的消亡。其中消亡项和[math]\displaystyle{ x(t)^2 }[/math]有关,也就是说种群数量越多,消亡得越快,这体现为该种群内部由于资源有限而引起的竞争。
数值试验
首先,可以用一系列数值试验的方法来探讨这个迭代方程。如果使用Mathematica数学软件,只需要用两句话就能实现这个迭代:
μ=0.9;x0=0.1;
NestList[μ # (1 - #) &, x0, 100]
通过对[math]\displaystyle{ μ }[/math]取值不同,分下面几种情况来进行讨论:
[math]\displaystyle{ 0≤μ≤1 }[/math]
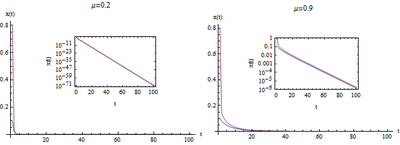
图2中左图表示的是当[math]\displaystyle{ \mu }[/math]=0.2,右图表示的是当[math]\displaystyle{ \mu }[/math]=0.9的时候方程的迭代结果。每张图都有两条曲线(蓝色和紫色),分别表示从初始值[math]\displaystyle{ x(0) }[/math]=0.1和[math]\displaystyle{ x(0) }[/math]=0.8开始得到的演化轨迹。每张图内的小图为纵坐标取对数之后的图形,可以看出系统趋向于0时候的速度,显然当[math]\displaystyle{ x(0) }[/math]=0.1的时候,速度更快。
可以观察到无论系统从何初值开始,也无论[math]\displaystyle{ \mu }[/math]取什么值,系统最终都会渐进地趋近于0。因此,当0<[math]\displaystyle{ \mu }[/math]<1时,系统的极限行为趋于0这个固定值。
也就是说,当0<[math]\displaystyle{ \mu }[/math]<1时,种群最终会灭亡,不论初始种群数有多大。
[math]\displaystyle{ 1\lt μ\lt 3 }[/math]
- 当[math]\displaystyle{ \mu }[/math]在1到2之间,种群数量会很快接近[math]\displaystyle{ \frac{\mu-1}{\mu} }[/math],不论最初种群为何值
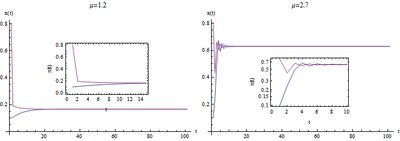
图3展示的是[math]\displaystyle{ \mu }[/math]=1.2,右图表示的是[math]\displaystyle{ \mu }[/math]=2.7的时候方程的迭代结果,我们看到,两种情况下,方程的迭代结果仍然收敛于固定值,分别是0.18和0.63。也就是说,这个稳定值可以随着[math]\displaystyle{ μ }[/math]发生变化。
- 当[math]\displaystyle{ \mu }[/math]在2到3之间,人口数在经历一段时间的波动后会趋于稳定值[math]\displaystyle{ \frac{\mu-1}{\mu} }[/math]其,收敛速度满足线性变化。但当[math]\displaystyle{ \mu }[/math]=3时,比线性收敛还要缓慢。(详情见Bifurcation memory)
事实上,只要[math]\displaystyle{ \mu }[/math]<3,系统都会收敛到一个不动点,而这个不动点的数值可以通过求解下列方程而得到:
- [math]\displaystyle{ x^*=\mu x^*(1-x^*) }[/math]
得到解为:
- [math]\displaystyle{ x^*_1=0,x^*_2=\frac{\mu-1}{\mu} }[/math]
其中,[math]\displaystyle{ x^*_1=0 }[/math]对应的是[math]\displaystyle{ \mu }[/math]<1时候的不动点,[math]\displaystyle{ x^*_2=\frac{\mu-1}{\mu} }[/math]对应的是[math]\displaystyle{ \mu }[/math]>1时候的不动点。
所谓的迭代不动点,也就是:一旦出现某一个[math]\displaystyle{ T }[/math]使得[math]\displaystyle{ x(T)=x^*_1,x^*_2 }[/math],则对任意的[math]\displaystyle{ t\gt T }[/math]都会有:[math]\displaystyle{ x(t)=x^*_1,x^*_2 }[/math]。
这就是上述两种情况。方程会收敛到不动点,并不会再产生新的[math]\displaystyle{ x(t) }[/math]值。
[math]\displaystyle{ 3\lt μ\lt 3.6 }[/math]
- 当[math]\displaystyle{ μ }[/math]在3到1+√6 ≈ 3.44949,在所有的初始条件下,人口数会持续在两个依赖[math]\displaystyle{ \mu }[/math]的值之间近似永久振荡。
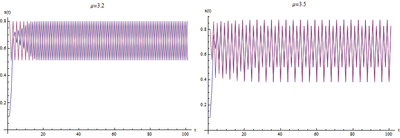
这个时候,方程的迭代会出现周期行为。随着[math]\displaystyle{ \mu }[/math]的增大,周期的长度也会相应地增加。如下图所示两种情况,左侧的周期为2,右侧的周期为4。
在左图4中,当[math]\displaystyle{ \mu }[/math]为3.2的时候,图形呈现锯齿状,表明[math]\displaystyle{ x(t) }[/math]在两个值之间:0.5和0.8上下徘徊。虽然从不同的初始值开始(蓝线和紫线),系统演化的轨迹并不一样,但是它们的终值却始终是0.5和0.8。
- 当[math]\displaystyle{ \mu }[/math]大约在3.44949和3.54409之间,在所有的初始条件下,人口数将在四个值之间近似永久振荡。后一个数字是一个12次多项式的根。在OEIS中查看A086181).
图4右图展示了当[math]\displaystyle{ \mu }[/math]=3.5的时候,系统在4个值上下反复跳动即0.87-->0.4-->0.82-->0.5。蓝色的轨迹和紫色的轨迹在初始略有不同,但是最终收敛到了一起。如果进一步增加[math]\displaystyle{ \mu }[/math]值,系统还会呈现出更多的周期,包括8周期、16周期……
[math]\displaystyle{ μ=3.6 }[/math]
事实上,从[math]\displaystyle{ \mu }[/math]>3.54以后,系统震荡的周期就变得越来越长。
- 当[math]\displaystyle{ μ }[/math]≈ 3.56995(在OEIS中的A098587),出现混沌现象,在倍周期级联的末端。在所有的初始条件下,不再观察到有限周期内的振动。 随着时间的推移,初始种群数的微小变化会产生明显不同的结果,这是混沌的主要特征。
- 3.56995以上的[math]\displaystyle{ μ }[/math]值大多表现出混沌行为,但仍有一定的孤立范围表现出非混沌行为;这些岛屿有时被称为稳定岛。例如,从1 +√8(约3.82843)开始,[3] 有一个参数[math]\displaystyle{ μ }[/math]的范围,在3个值之间显示[math]\displaystyle{ \mu }[/math]振荡,在6个值之间显示稍高的[math]\displaystyle{ \mu }[/math]振荡,然后在12个值之间显示稍高的[math]\displaystyle{ \mu }[/math]振荡,等等.
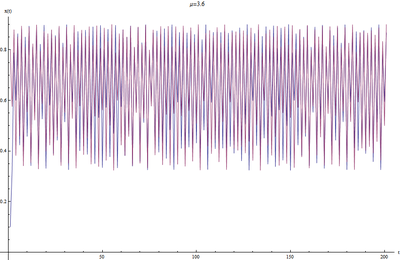
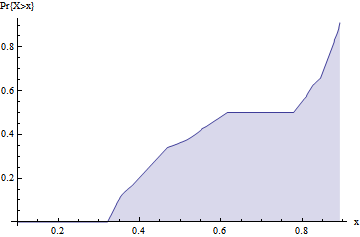
直到大概3.6的时候,周期长度趋向于无穷大,此时,系统开始了混沌状态。随着系统的演化,[math]\displaystyle{ x(t) }[/math]的值会一直在0.3到0.9之间徘徊,没有固定的周期,而且行为很随机。不同的初始状态演化的轨迹也不重合。可以统计不同时刻的[math]\displaystyle{ x(t) }[/math]值在区间[0.3,0.9]之上的统计分布,如下所示:
图6中所示为一次模拟试验运行了20000个周期,[math]\displaystyle{ x(t) }[/math]在这不同时刻的值在[0,1]区间上的累计分布图。图形中的平台部分表示取值概率基本为0。也就是说[math]\displaystyle{ x(t) }[/math]的取值基本集中在0.3~0.6和0.8~0.9这两个区间里。而往右上按照直线倾斜的部分表示[math]\displaystyle{ x(t) }[/math]在该区间近似呈现均匀分布。由此可见,这个时候迭代系统表现出随机性,然而整个迭代方程都是确定性的,因此认为产生了确定性的混沌。
[math]\displaystyle{ 3.6\lt μ\lt 4 }[/math]
当参数[math]\displaystyle{ \mu }[/math]从大约3.56995变化到3.82843时,Logistic映射的混沌行为的发展过程有时被称为the Pomeau–Manneville scenario,其特征是周期性(层流)阶段被非周期性行为突然打断。The Pomeau–Manneville scenario在半导体器件中有应用。[4] 此时函数值在5个值之间来回波动;所有的振荡周期都依赖于[math]\displaystyle{ \mu }[/math]。带参数[math]\displaystyle{ c }[/math]的倍周期是由一系列子序列组成的[math]\displaystyle{ \mu }[/math]值范围。第k个子区间包含了[math]\displaystyle{ \mu }[/math]的值,其中有一个[math]\displaystyle{ 2^{k}c }[/math]的稳定周期(一个周期吸引了一组单位测度的初始点)。这个子范围的序列称为谐波级联cascade of harmonics。[5] 在一个稳定周期为[math]\displaystyle{ 2^{k^*}c }[/math]的子范围内,所有[math]\displaystyle{ k \lt k^* }[/math]都存在周期为[math]\displaystyle{ 2^{k}c }[/math]的不稳定周期。在无限子区间序列末端的[math]\displaystyle{ \mu }[/math]值称为谐波级联的积累点。随着[math]\displaystyle{ \mu }[/math]的升高,出现了一系列具有不同[math]\displaystyle{ c }[/math]值的新窗口。第一个是[math]\displaystyle{ c }[/math] = 1;所有包含奇数[math]\displaystyle{ c }[/math]的后续窗口都以[math]\displaystyle{ c }[/math]的递减顺序出现,以任意大的[math]\displaystyle{ c }[/math]开始。[5][6]
当[math]\displaystyle{ \mu }[/math]持续增大的时候,迭代运行的轨道就会在周期类型和混沌类型之间来回切换。直到[math]\displaystyle{ \mu }[/math]=4,系统处于完全混沌的状态,最终的长期行为会在[0,1]区间上均匀分布。
[math]\displaystyle{ μ = 4 }[/math]
[math]\displaystyle{ \mu }[/math] = 4的特殊之处与[math]\displaystyle{ \mu }[/math]= 2相同,其可以获得精确的解,[7] 虽然,一般情况只能通过统计来预测。[8]
当[math]\displaystyle{ \mu }[/math] = 4 时,[7][9]
- [math]\displaystyle{ x_{n}=\sin^{2}\left(2^{n} \theta \pi\right), }[/math]
给出初始参数 [math]\displaystyle{ \theta }[/math] :
- [math]\displaystyle{ \theta = \tfrac{1}{\pi}\sin^{-1}\left(\sqrt{x_0}\right). }[/math]
针对有理数的[math]\displaystyle{ \theta }[/math],有限次数的迭代后[math]\displaystyle{ x_t }[/math]就会变成一个周期性的数列。不过几乎所有的[math]\displaystyle{ \theta }[/math]都是无理数,此时[math]\displaystyle{ x_t }[/math]不会重复,因此没有周期解。此解可以清楚的看出混沌的二个重要特征:拉伸及折叠。系数[math]\displaystyle{ 2^t }[/math]表示拉伸的指数增长,因此造成蝴蝶效应,也就是对初始值的高度依赖性,而解中包括正弦函数的平方,使解折叠在[0,1]的范围内。
对于[math]\displaystyle{ \mu }[/math]= 4,用复数代替三角函数的等价解为:[10]
- [math]\displaystyle{ x_t=\frac{-\alpha^{2^t} -\alpha^{-2^t} +2}{4} }[/math]
[math]\displaystyle{ \alpha }[/math]也是复数
其模量为1,正如就像三角函数中的平方正弦函数不会导致点集的缩小或扩大,在后者的解决方案中,可通过[math]\displaystyle{ \alpha }[/math]的单位模量来实现该种结果。
相比之下,[math]\displaystyle{ \mu }[/math] =2的解为:[10]
- [math]\displaystyle{ x_t = \frac{1}{2} - \frac{1}{2}(1-2x_0)^{2^{t}} }[/math]
对于[math]\displaystyle{ x_0 \in [0,1) }[/math]。此解没有混沌的特性。由于对不包括不稳定的不动点点0在内的[math]\displaystyle{ x_{0} }[/math],当[math]\displaystyle{ t }[/math]趋近无限大时,[math]\displaystyle{ (1-2x_0)^{2^{t}} }[/math]会趋近于零,因此[math]\displaystyle{ x_t }[/math]会趋近稳定的不动点[math]\displaystyle{ \tfrac{1}{2}. }[/math]。
[math]\displaystyle{ \mu }[/math] =4时,几乎所有的初值都会使Logistic映射出现混沌特性,不过也存在无限个初值会使Logistic映射最后呈周期性变化。而且对于所有正整数,都存在一初值使Logistic映射的周期为正整数。可以利用
Logistic映射和移位映射 Dyadic transformation之间的关系来找出任何周期的循环。若[math]\displaystyle{ x }[/math]依照Logistic映射[math]\displaystyle{ x_{t+1} = 4 x_t(1-x_t) }[/math],而[math]\displaystyle{ y }[/math]依照移位映射
- [math]\displaystyle{ y_{t+1}=\begin{cases}2y_t & 0 \le y_t \lt 0.5 \\2y_t -1 & 0.5 \le y_t \lt 1, \end{cases} }[/math]
则二个变量的关系如下:
- [math]\displaystyle{ x_{t}=\sin^{2}(2 \pi y_{t}) }[/math].
当[math]\displaystyle{ y }[/math]以二进制表示时,映射会将二进制的数字左移一位(若左边的二进制点为1,则这个1会变为0),该种映射也称为二元转换或移位映射。例如,如果迭代的二进制扩展中有一个3位重复序列(并不是一个1位重复序列),则会发生长度为3的循环。迭代001001001…映射到010010010…,映射到100100100…,反过来又映射成原来的001001001…;这是一个3循环的移位图。循环节为010, 011, 100, 101, 110 时也会有类似情形。
另外三个二值展开重复序列给出了三次循环110110110…→101101101…→011011011…→110110110。这些循环小数都可以转换为对应的分数,第一个给定的周期为3的循环小数若以分数表示则为:1/7 → 2/7 → 4/7 → 1/7。
将其转换到[math]\displaystyle{ \mu }[/math]=4的Logistic映射后,所得到的逻辑循环为611260467... → 950484434... → 188255099... → 611260467...。其他周期为3的循环也可以转换为Logistic映射。同样地,任何长度为k的循环都可以在移位映射中找到,然后转换成相应的Logistic映射。
对于[math]\displaystyle{ \mu }[/math]=4的Logistic映射,此时对应[math]\displaystyle{ \mu }[/math]= 2的帐篷映射 Tent map。(最小)长度k = 1,2,3,…的循环数是一个已知的整数序列(OEIS中的序列A001037):2,1 ,2、3、6、9、18、30、56、99、186、335、630、1161…这告诉我们,[math]\displaystyle{ \mu }[/math]=4的Logistic映射具有2个不动点点,长度为2时的周期为1,长度为3时的周期为2,依此类推。对于素数k有序列:[math]\displaystyle{ 2\frac{2^{k-1}-1}{k} }[/math]
例如:[math]\displaystyle{ 2\frac{2^{13-1}-1}{13} }[/math]是长度为13的循环数。在所有初始条件下,映射都是混乱的,所以这些有限长度的循环都是不稳定的。
不同参数[math]\displaystyle{ \mu }[/math]下的极限行为
不论[math]\displaystyle{ \mu }[/math]取任意值,最多有一个稳定的周期。 如果存在一个稳定的周期,那么它是全局稳定的,吸引了几乎所有的点。[11]一些具有周期稳定循环的[math]\displaystyle{ \mu }[/math]在某些时候会有无穷多个不同周期的不稳定循环。
为了概括上述各种数值模拟试验的结果,我们用下面的相图来表示不同[math]\displaystyle{ μ }[/math]值对应的极限行为。
图8中显示的每一个参数[math]\displaystyle{ \mu }[/math]所对应的迭代的极限行为。在相同的参数下,我们通过从不同的初始值(共有1000个)开始迭代足够多的次数(T=2000次),记录下这些数据点对应的[math]\displaystyle{ x(T) }[/math]值。为了让显示效果更好看,我们对处于相同区域的数据点进行了归并,从而可以用某一点灰度的大小来表示该区域数据点的多少。最后的数学软件代码如下所示:
interval = 0.001;
results = Reverse[Transpose[Table[
   logisticValues =
    Table[Nest[a # (1 - #) &, RandomReal[], 2000], {1000}];
   intervals = Table[i, {i, 0, 1 - interval, interval}];
   result = BinCounts[logisticValues, {0, 1, interval}]/1000;
   Log[result + 0.001]
   , {a, 2.9, 4, 0.001}]]];
gradraft =
ArrayPlot[70 + 10 results, FrameLabel -> {"x(T)", "\[Mu]"},
 FrameTicks -> {Table[{i, N[(i - 1)/(Length[results] - 1)]}, {i,
     0.1*(Length[results] - 1) + 1,
     0.9 (Length[results] - 1) + 1, (Length[results] - 1)/4}],
   Table[{i,
     N[2.9 + (i - 1)*(4 - 2.9)/(Length[results[[1]]] - 1),
      1]}, {i, (3 - 2.9) (Length[results[[1]]] - 1)/(4 - 2.9) + 1,
     Length[results[[1]]], (Length[results[[1]]] - 1)/5}]}]
其中1000为初始值的个数,2000为迭代的时间步。interval为区域的划分尺度。
混沌与Logistic映射
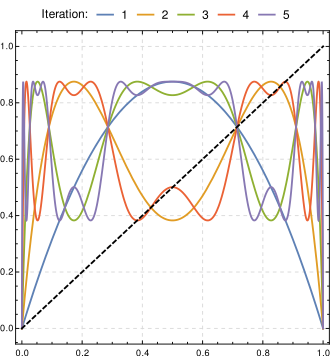
Logistic映射[math]\displaystyle{ f }[/math] (blue)在[math]\displaystyle{ \mu }[/math]=3.5的条件下进行迭代,得到[math]\displaystyle{ f^2 }[/math]、[math]\displaystyle{ f^3 }[/math] 、[math]\displaystyle{ f^4 }[/math]和 [math]\displaystyle{ f^5 }[/math]。 例如,对于水平轴上的任何初始值,[math]\displaystyle{ f^4 }[/math]为四次迭代之后得到的值。和其他混沌系统比较,Logistic映射的相对简单性使它成为考虑混沌概念的一个广泛使用的切入点。简单来说,混沌就是对初始条件的高度灵敏度。[math]\displaystyle{ \mu }[/math]=3.5是在3.57及4之间的大部分数值都可以使Logistic映射出现该特性。[1] 由于映射本身对定义域的拉伸及折叠,使得其对初始条件有高度灵敏度,故表现出来了混沌特性。Logistic映射的二次差分方程可视为是对于区间(0,1)拉伸及折叠的过程。[12]
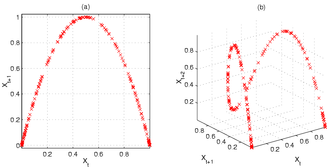
图10中,右图说明了在Logistic映射的迭代序列上的伸展和折叠。左边 图(a) 显示了Logistic映射在[math]\displaystyle{ \mu }[/math]=4条件下的二维庞加莱图,并清楚地显示了差分方程的二次曲线。利用二维及三维的相图可以看出一些Logistic映射的特性。以[math]\displaystyle{ \mu }[/math]=4的Logistic映射为例,二维相图为一抛物线,但是若用相同的序列绘制三维相图,可看出进一步的结构,例如几个一开始很接近的点在迭代后开始发散.特别是位在斜率较大位置的点。
此外,以便研究Logistic映射的更深层结构。 图(b)演示了在最初点的附近是如何开始分叉的,特别是在与图中更陡的部分相对应的 [math]\displaystyle{ x_t }[/math] 区域。
拉伸及折叠的结果使迭代的数列以指数形式发散(参照李亚普诺夫指数),可以用有混沌特性时的Logistic映射的复杂性及不可预测性加以说明。事实上,数列的指数发散说明了混沌和不可预测性之间的关系:初值微小的误差在迭代过程中会以指数成长的方式增加,导致结果出现很大的误差。因此当对于初始状态的有微小的误差时.对未来状态的预测准确度也会随迭代次数增加而快速变差。这种不可预测性和明显的随机性使得在早期的计算机中利用Logistic方程生成伪随机数。[12]
由于映射的函数值收敛于某一特定值,其维度小于或等于1。依数值分析的结果,在[math]\displaystyle{ \mu }[/math]=3.5699456...时(刚开始混沌特性时),其关联维度为0.500 ± 0.005(Grassberger,1983)、豪斯多夫维数大约是0.538(Grassberger 1981),而分形维数为0.5170976...(Grassberger,1983),还可得知关联维度进一步精确在0.4926和0.5024之间。
有些混沌系统可对于其未来状态的可能性作准确的描述。若一个可能有混沌特性的动力系统存在吸引子,则存在一概率量测描述系统长期在吸引子各部分所花时间的比例。以[math]\displaystyle{ \mu }[/math]=4的Logistic映射为例,初始状态在区间(0,1)中,而吸引子也在区间(0,1)中,其概率量测对应参数[math]\displaystyle{ a }[/math]=0.5,[math]\displaystyle{ b }[/math]=0.5的Β分布[13],其不变测度为:
- [math]\displaystyle{ {\frac {1}{\pi {\sqrt {x(1-x)}}}} }[/math]。
不可预期性和随机并不一样,不过在一些情形下这二者很类似。 因此,幸运的是,即使我们对Logistic映射(或其他混沌系统)的初始状态知之甚少,我们仍然可以说一些关于任意未来状态分布的问题,并参考一些信息来判断系统的状态从而做出决定。
分岔行为
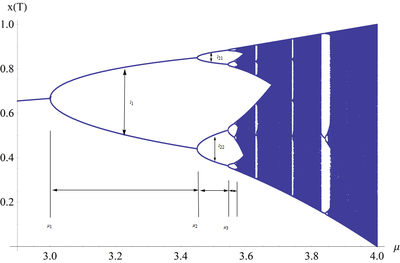
图11中分岔图总结了这一点。横轴表示参数[math]\displaystyle{ \mu }[/math]的可能值,纵轴表示x的一组值,通过与该[math]\displaystyle{ \mu }[/math]值的Logistic映射的迭代,从初始条件中一步步接近所得到的x一组值。
分岔图具有自相似性:如果我们把上面提到的[math]\displaystyle{ μ }[/math]≈3.82843的图像放大,然后把焦点放在这三个值中的一个上,那么附近的情况看起来就像是整个图的缩小和略微扭曲的版本。这同样适用于所有其他非混沌点。这是混沌和分形之间深刻而普遍的联系的一个例子。
二分周期点
观察图形,我们发现,随着[math]\displaystyle{ \mu }[/math]逐渐增大,系统迭代的周期会逐渐增多,从1个变2个,2个变4个,……。我们将这些周期分岔点所对应的[math]\displaystyle{ \mu }[/math]参数值记为[math]\displaystyle{ \mu_1,\mu_2,\cdot\cdot\cdot }[/math]。我们会发现,这些点之间的间距,即[math]\displaystyle{ \mu_{i+1}-\mu_{i} }[/math]会变得越来越小。那么,这些点是如何确定的呢?
事实上,迭代方程[math]\displaystyle{ x(t+1)=\mu x(t)(1-x(t)) }[/math]决定了系统的一切行为。因此,它也必然决定了这些分岔点所对的位置。我们知道,如果迭代的极限点只有一个,那么,我们事实上可以通过求解下述方程得到这个极限点:
- [math]\displaystyle{ x^*=\mu x^*(1-x^*) }[/math]
同样的道理,当迭代方程的极限行为出现两个周期点的时候,我们不妨设这两个点分别为[math]\displaystyle{ x_1,x_2 }[/math],则从[math]\displaystyle{ x_1 }[/math]开始一步迭代应该能得到[math]\displaystyle{ x_2 }[/math],而从[math]\displaystyle{ x_2 }[/math]开始迭代又得到[math]\displaystyle{ x_1 }[/math],周而复始,因此,我们可以列出方程:
- [math]\displaystyle{ \left\{\begin{array}{ll} x_2=f(x_1),&\\ x_1=f(x_2).& \end{array}\right. }[/math]
其中,我们定义[math]\displaystyle{ f(x)=\mu x (1-x) }[/math]。如果将[math]\displaystyle{ x_2=f(x_1) }[/math]代入第二个方程,那么上述方程组相当于求解:
- [math]\displaystyle{ x^*=f(f(x^*))= f^{(2)}(x^*)=\mu^2 x^* - \mu^2 (x^*)^2 - \mu^3 (x^*)^2 + 2 \mu^3 (x^*)^3 - \mu^3 (x^*)^4 }[/math]
显然,这是一个一元四次方程,我们可以求解该方程得到四个解:
- [math]\displaystyle{ x_1^*=\frac{1}{2}(1+\frac{1}{\mu}+\frac{\sqrt{-3-2\mu+\mu^2}}{\mu}),x_2^*=\frac{1}{2}(1+\frac{1}{\mu}-\frac{\sqrt{-3-2\mu+\mu^2}} {\mu}),x_3^*=0, x_4^*=\frac{\mu-1}{\mu} }[/math]
其中第3个是和第4个是不动点。我们知道,如果[math]\displaystyle{ x* }[/math]是迭代方程的不动点,那么,[math]\displaystyle{ x* }[/math]一定也是迭代方程的2周期点、4周期点、任意的周期点。所以,后两个解并非我们要求的二周期点。而第1和第2个解才是真正的二分周期点。我们可以验证:
- [math]\displaystyle{ x_1^*=f(x_2^*),x_2^*=f(x_1^*) }[/math]。
为了让这2个解有意义,[math]\displaystyle{ \mu }[/math]必须使得根号中的式子大于0,也就是[math]\displaystyle{ -3-2\mu+\mu^2\gt 0 }[/math],于是可以推得:
- [math]\displaystyle{ \mu }[/math]>3或者[math]\displaystyle{ \mu }[/math]<-1
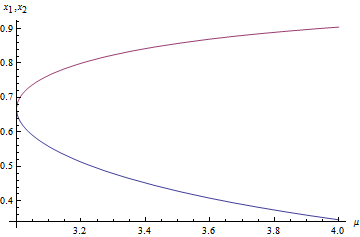
因为[math]\displaystyle{ \mu }[/math]始终在范围[0,4]之内,因此,只要[math]\displaystyle{ \mu }[/math]>3就会存在二分周期点。并且,我们可以画出这两个解[math]\displaystyle{ x_1^*,x_2^* }[/math]随[math]\displaystyle{ \mu }[/math]而变的图形:
其中,下面蓝色曲线为[math]\displaystyle{ x_1^* }[/math],上面的为[math]\displaystyle{ x_2^* }[/math]。与上一小节的系统极限行为随[math]\displaystyle{ \mu }[/math]变化图相比,该图显然夸大了二分周期点的存在范围。看来,我们不能仅仅根据满足迭代关系这一个条件来确定二分周期点发生的参数区间。
二分周期点的稳定性
仔细分析会发现,如果系统的极限行为要产生二分周期点,除了需要满足迭代关系之外,还需要满足稳定性条件。也就是说从周期点[math]\displaystyle{ x_1^* }[/math]或者[math]\displaystyle{ x_2^* }[/math]邻近的点出发,系统经过几步迭代仍然能回归到这两个周期点之一,而不能跑掉。于是,这就给参数[math]\displaystyle{ \mu }[/math]设置了更加苛刻的条件。
下面,我们来对该迭代方程在二分周期点[math]\displaystyle{ x_1^*,x_2^* }[/math]附近做稳定性分析。首先,我们知道如果[math]\displaystyle{ x^* }[/math]是二分周期点,那么必然有:
- [math]\displaystyle{ x^*=f(f(x^*))=f^{(2)}(x^*) }[/math]
我们对[math]\displaystyle{ x^* }[/math]做微扰,即把[math]\displaystyle{ x^* }[/math]加上小量[math]\displaystyle{ \epsilon(t) }[/math]再代入迭代方程,得到的新点应该仍然在[math]\displaystyle{ x^* }[/math]点附近,因此:
- [math]\displaystyle{ x^*+\epsilon(t+1)=f^{(2)}(x^*+\epsilon(t)) }[/math]
我们将右侧在[math]\displaystyle{ x^* }[/math]附近做泰勒展开,并求一级近似。得到:
- [math]\displaystyle{ f^{(2)}(x^*+\epsilon(t))\approx f^{(2)}(x^*)+\frac{\partial f^{(2)}(x)}{\partial{x}}\mid_{x=x^*}\epsilon(t) }[/math]
于是,代入迭代方程:
- [math]\displaystyle{ x^*+\epsilon(t+1)\approx f^{(2)}(x^*)+\frac{\partial f^{(2)}(x)}{\partial{x}}\mid_{x=x^*}\epsilon(t) }[/math]
因为[math]\displaystyle{ x^*=f^{(2)}(x^*) }[/math],所以:
- [math]\displaystyle{ \epsilon(t+1)=\frac{\partial f^{(2)}(x)}{\partial{x}}\mid_{x=x^*}\epsilon(t) }[/math]
于是:
- [math]\displaystyle{ \frac{\epsilon(t+1)}{\epsilon(t)}=\frac{\partial f^{(2)}(x)}{\partial{x}}\mid_{x=x^*} }[/math]
因此,要让小扰动[math]\displaystyle{ \epsilon(t) }[/math]不会对系统后续的演化轨道造成太大的偏离,就必须让新的[math]\displaystyle{ \epsilon(t+1) }[/math]随着迭代越来越小,也就是让
- [math]\displaystyle{ \begin{vmatrix}\frac{\epsilon(t+1)}{\epsilon(t)}\end{vmatrix}=\begin{vmatrix}\frac{\partial f^{(2)}(x)}{\partial{x}}\mid_{x=x^*}\end{vmatrix}\lt 1 }[/math]
将已经求得的二分周期点[math]\displaystyle{ x_{1,2}^* }[/math]代入上式,进行化简、去除不合理的参数范围,得到[math]\displaystyle{ \mu }[/math]需要满足如下不等式:
- [math]\displaystyle{ 3\lt \mu\lt 1+\sqrt{6} }[/math]
也就是说,在这个参数范围内,迭代方程存在着两个稳定的二周期极限点。对照图1,我们实际上已经求得了二分周期的启始和终止位置[math]\displaystyle{ \mu_1=3,\mu_2=1+\sqrt{6} }[/math]。
其它的倍分周期点
接下来,我们可以利用同样的方法求解稳定的4周期点,只需要求解[math]\displaystyle{ f^{(4)} }[/math]的稳定不动点,由此给出参数[math]\displaystyle{ \mu }[/math]的范围。一般地,对于[math]\displaystyle{ 2^p }[/math]周期点,我们只需要求解如下方程:
- [math]\displaystyle{ x^*=f^{(2^p)}(x^*) }[/math]
并要求此不动点是稳定的,即:
- [math]\displaystyle{ \begin{vmatrix}\partial{f^{(2^p)}}\end{vmatrix}\lt 1 }[/math]
就可以相应地求出参数的范围,即[math]\displaystyle{ \mu_{p},\mu_{p+1} }[/math]。
费根鲍姆常数
自相似性
这个Logistic映射的分岔图具有明显的自相似性:
可以看到在两个分岔点[math]\displaystyle{ \mu_n }[/math]与[math]\displaystyle{ \mu_{n+1} }[/math]之间的区域,图形是自相似的两个“小山头”。为了刻画这种自相似性,引入两个比例数值,分别是费根鲍姆第一、第二常数。
[math]\displaystyle{ δ }[/math]
此时倍分周期点所对应的参数值序列[math]\displaystyle{ \mu_1,\mu_2,\mu_3,\cdot\cdot\cdot }[/math]彼此之间的间隔会变得越来越小,而且似乎呈现出按照指数衰减的趋势。可以如下定义:
- [math]\displaystyle{ \delta_n=\frac{\mu_{n-1}-\mu_{n-2}}{\mu_{n}-\mu_{n-1}} }[/math]
来刻画这个区间长度逐渐变小的速度。下面是相应的数值计算:
n 周期 分岔参数 ([math]\displaystyle{ \mu_n }[/math]) 比例 [math]\displaystyle{ \delta_n=\dfrac{\mu_{n-1}-\mu_{n-2}}{\mu_n-\mu_{n-1}} }[/math] 1 2 3 N/A 2 4 3.4494897 N/A 3 8 3.5440903 4.7514 4 16 3.5644073 4.6562 5 32 3.5687594 4.6683 6 64 3.5696916 4.6686 7 128 3.5698913 4.6692 8 256 3.5699340 4.6694
可以明显的看到,[math]\displaystyle{ \delta_n }[/math]会越来越趋近一个常数:4.6694,人们把这个常数计作[math]\displaystyle{ \delta }[/math],并命名为费根鲍姆常数(第一常数),用来纪念他的发现者,美国物理学家费根鲍姆,它的精确值可以写作:
- [math]\displaystyle{ \delta=4.6692016091029906718532038\cdot\cdot\cdot }[/math]
[math]\displaystyle{ α }[/math]
除此之外,在这个简单的Logistic映射中,费根鲍姆还发现了第二个普适常数可以用来刻画分岔图的自相似性。 如图2中,定义第p个周期点第q个分岔的高度为lp,q,其中横坐标的选取是迭代映射在第p个周期分岔中满足超稳定不动点条件的特殊的参数[math]\displaystyle{ \mu }[/math]值,该数值[math]\displaystyle{ \hat{\mu_p} }[/math]为满足下列方程的解:
- [math]\displaystyle{ (\frac{\partial{f^{(2^p)}(\mu,x)}}{\partial{x}})|_{x=x^*}=0 }[/math]
其中,[math]\displaystyle{ f(\mu,x)=\mu x(1-x) }[/math], [math]\displaystyle{ x^* }[/math]是[math]\displaystyle{ 2^p }[/math]周期迭代的不动点,即方程[math]\displaystyle{ f^{(2^p)}(x^*)=0 }[/math]的解。例如,在Logistic映射中,如果p=1,则:[math]\displaystyle{ \hat{\mu_p}=1+\sqrt{5} }[/math]。由这些[math]\displaystyle{ \hat{\mu_p} }[/math]代入不动点方程,就可以求出相应的高度。
费根鲍姆发现,沿着任意一个分岔的分支行走,任意两个相邻分支的高度之比,例如图2中的[math]\displaystyle{ l_1/l_{2,1} }[/math]的极限为常数α。这个常数称为费根鲍姆第二常数,近似值为[math]\displaystyle{ \alpha }[/math]=2.5029。
普适性
具有抛物极大值和费根鲍姆常数(包括[math]\displaystyle{ \delta }[/math]=4.669201...,[math]\displaystyle{ \alpha }[/math]=2.502907...)[14] [15] 的一维映射在Logistic映射作为离散激光动力学的模型时容易察觉其具有的普遍性质。[math]\displaystyle{ x \rightarrow G x (1 - \tanh (x)) }[/math],x为电场振幅,[math]\displaystyle{ G }[/math][16]为激光增益分岔参数。
当[math]\displaystyle{ G }[/math]在区间[math]\displaystyle{ [0,\infty) }[/math]中逐渐增大时,其动力学由规则型变为混沌型,[17] 其分岔图在某些性质上与Logistic映射相同。
更有趣的是,费根鲍姆常数[math]\displaystyle{ \delta }[/math]不仅仅对于Logistic映射方程成立,它对一类映射方程:[math]\displaystyle{ x(t+1)=f(x(t)) }[/math]都成立,并且取同样的值。其中[math]\displaystyle{ f(x)=a g(x) }[/math],[math]\displaystyle{ a }[/math]为常数,[math]\displaystyle{ g(x) }[/math]为[0,1]区间上的Logistic函数。例如,对于迭代方程:
- [math]\displaystyle{ f(x)=a-x^2=a(1-\frac{x^2}{a}). }[/math]
也可以计算得到相同的费根鲍姆常数:
n 周期 分岔参数 (an) 比例 [math]\displaystyle{ \dfrac{a_{n-1}-a_{n-2}}{a_n-a_{n-1}} }[/math] 1 2 0.75 N/A 2 4 1.25 N/A 3 8 1.3680989 4.2337 4 16 1.3940462 4.5515 5 32 1.3996312 4.6458 6 64 1.4008287 4.6639 7 128 1.4010853 4.6682 8 256 1.4011402 4.6689
又比如函数[math]\displaystyle{ f(x)=a x(1-x^2) }[/math],可以计算得到:
n 周期 分岔参数 (an) 比例 [math]\displaystyle{ \dfrac{a_{n-1}-a_{n-2}}{a_n-a_{n-1}} }[/math] 1 2 2.121 N/A 2 4 2.263 N/A 3 8 2.294 4.665 4 16 2.300 4.668 5 32 2.301 4.669 6 64 2.302 4.669
由此,可见费根鲍姆常数具有很强的普适性。
重整化群方程与费根鲍姆常数
通过图像可以观察到,Logistic迭代的倍分岔图产生了自相似的现象,即从2p周期到2p+1周期的小山峰彼此相似。这种自相似性可以用费根鲍姆常数[math]\displaystyle{ \delta }[/math]和[math]\displaystyle{ \alpha }[/math]刻画。一般通过重整化方法得到两个常数的精确解,且发现对于不同方程的迭代,会得到同样的费根鲍姆常数。重整化方法可以根据系统所具备的自相似性,写出重整化方程,从而给出相变点的精确位置以及临界指数。这种方法在渗流模型,ISING模型中得到了成功的应用。因为在Logistic迭代中也存在着自相似现象,因此,也可以利用重整化的思路。
时间上的尺度变换
重整化方法涉及到用多个不同的尺度来观察系统,从而抓住尺度变换过程中不变性。对于一维的迭代系统:
- [math]\displaystyle{ x(t+1)=f(x(t)) }[/math]
时间 t 相当于空间,该映射可以得到一系列不同时刻的点[math]\displaystyle{ x(1) }[/math],[math]\displaystyle{ x(2) }[/math],……。假如进行放大尺度,忽略掉一些信息,即不是以1为间隔进行采样,而是以2为间隔进行,就会得到:[math]\displaystyle{ x(1) }[/math],[math]\displaystyle{ x(3) }[/math],[math]\displaystyle{ x(5) }[/math],……。因此这个粗粒化的序列相当于按照如下方程进行迭代而成:
- [math]\displaystyle{ x'(t+1)=f(f(x'(t))=f^{(2)}(x'(t)) }[/math]
所以,对Logistic迭代进行扩缩,实际上就是在对迭代进行归并,从而将迭代的法则[math]\displaystyle{ f(x) }[/math]变换成[math]\displaystyle{ f^{(2)}(x) }[/math]。而迭代法则[math]\displaystyle{ f(x) }[/math]实际上制约了动力系统的全部性质。所以,当人们说系统在不同的分岔点具有自相似性质的时候,实际上就是在考察迭代法则[math]\displaystyle{ f(x) }[/math]在尺度变换下,即[math]\displaystyle{ f(x)\rightarrow f^{(2)}(x) }[/math]是否具有某种不变的形式。如果迭代法则[math]\displaystyle{ f(x) }[/math]具有了尺度变化下的不变性,那么根据前面的讨论,它的一切性质(包括分岔的长度和高度等)就会具有自相似性。因此,迭代法则[math]\displaystyle{ f(x) }[/math]就像ISING模型中的配分函数,起到了主导的作用。
迭代法则的自相似性
可以将不同时间尺度下的[math]\displaystyle{ f(x) }[/math]图像画出来进行直观地比较,透彻分析迭代法则[math]\displaystyle{ f(x) }[/math]在尺度变换下的自相似性质。首先,画出[math]\displaystyle{ f(x) }[/math]当[math]\displaystyle{ \mu=\hat{\mu^{(1)}}=2 }[/math]的时候,[math]\displaystyle{ f^{(2)}(x) }[/math]在[math]\displaystyle{ \mu=\hat{\mu^{(2)}}=1+\sqrt{5} }[/math]的时候的函数图像(其中[math]\displaystyle{ \hat{\mu^{(p)}} }[/math]为满足相应第p重迭代函数的超稳定周期条件:[math]\displaystyle{ \frac{\partial{f^{(p)}(\hat{\mu^{(p)}},x)}}{\partial x}|_{x=x^*}=0 }[/math]下对应的参数值)。函数图如下:
可以在这种“超稳定”的参数下观察函数的自相似性,如图2所示,不同小山峰之间彼此相似,而每个倍分周期的超稳定参数点刚好位于小山峰的“中心”位置,所以,该点附近的迭代法则的相似性就直接对应了不同小山峰之间的相似性。在上图中,右图中的绿色区域刚好和左图全体相似,就好像把左图上下颠倒、左右颠倒,再缩小一定比例[math]\displaystyle{ \alpha }[/math](一个固定的常数,后面可以求出),就得到了右图。
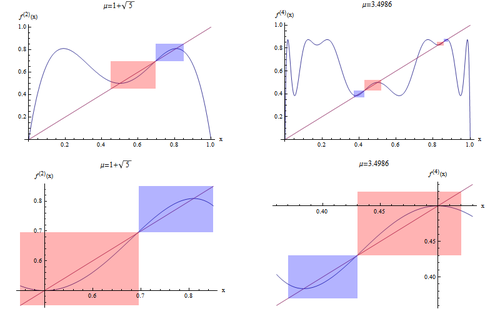
同理再看[math]\displaystyle{ f^{(2)}(x) }[/math]与[math]\displaystyle{ f^{(4)}(x) }[/math]之间的相似性,如图15中两张图所示。
对于[math]\displaystyle{ f^{(2)}(x) }[/math]与[math]\displaystyle{ f^{(4)}(x) }[/math],可以画出当[math]\displaystyle{ \mu }[/math]在相应的超稳定周期参数的时候的函数图像。右上图中的蓝色和红色区域刚好与左上图中的蓝色和红色区域相似。它们也是上下颠倒,再进行缩放变换、左右颠倒。如果选择右上图中的蓝、红色区域进行放大得到右下图,同样将左上方图的染色区域放大得到左下图。另外,如果将坐标系原点移到了中心位置(即[math]\displaystyle{ f(x)=\mu x(1-x) }[/math]最大值所对应的位置(0.5,0.5))。
图形变换与相似性
我们可以把这种图形变化用数学来表示。为了让图15中右下子图和左下子图彼此相似,我们需要对右下子图进行水平、竖直翻转、缩放(以(0.5,0.5)为轴)才能与左下图重合。也就是:
- [math]\displaystyle{ f^{(2)}\rightarrow -\alpha f^{(4)}(\hat{\mu_2},-\frac{x}{\alpha}) }[/math]
其中箭头的意思表示对应关系,或者相似关系,也就是说[math]\displaystyle{ f^{(2)} }[/math]这个函数图形与[math]\displaystyle{ f^{(4)} }[/math]经过缩放、翻转之后的图形相似。
如果我们不停地画出更高阶的函数图像[math]\displaystyle{ f^{2^p}(x),f^{2^{p+1}}(x),\cdot\cdot\cdot }[/math],都能发现它们与p+1阶的函数图像都有上述自相似关系,也就是:
- [math]\displaystyle{ f^{(2^p)}\rightarrow -\alpha f^{(2^{(p+1)})}(\hat{\mu_2},-\frac{x}{\alpha}) }[/math]
重整化
上一节仅仅针对Logistic迭代,然而,对于其他的单峰函数,也有类似的自相似性,以及不同阶映射法则之间的图形变换对应。更普遍的是,可以把不同阶映射法则的自相似性作为一个前提而非最终的观察结果来引入,从而反过来求解什么样的函数[math]\displaystyle{ f(x) }[/math]才会具有这种性质。最终发现[math]\displaystyle{ f(x) }[/math]函数的具体性质并不重要,有相当一大类函数都可以最终得到同样的自相似性结果。而费根鲍姆常数也跟具体的迭代函数[math]\displaystyle{ f(x) }[/math]无关,而仅仅与所要求的系统具备的自相似性质有关。
事实上,如果从不同时间尺度来考察迭代系统的行为,那么迭代函数的自相似要求就变成了重整化群方程。而最终满足重整化方程的函数集合实际上就是重整化理论中的普适类。
重整化群方程
下面,将不同阶迭代法则之间的相似几何关系作为一个基本要求。即对于任意的迭代法则[math]\displaystyle{ f(\mu,x) }[/math],其中[math]\displaystyle{ f(\mu,x) }[/math]可以写为[math]\displaystyle{ f(\mu,x)=\mu g(x) }[/math],[math]\displaystyle{ g(x) }[/math]为[0,1]内的单峰函数,要求它在变换R下不变。其中R为对函数[math]\displaystyle{ f }[/math]进行一系列操作:
(1) 从[math]\displaystyle{ f }[/math]得到[math]\displaystyle{ f^{(2)} }[/math]:[math]\displaystyle{ f^{(2)}=f(f(\hat{\mu_1},x)) }[/math],其中[math]\displaystyle{ \hat{\mu_1} }[/math]为[math]\displaystyle{ f }[/math]的超稳定不动点对应的参数;
(2) 从[math]\displaystyle{ f^{(2)} }[/math]可以计算出它的超稳定不动点[math]\displaystyle{ \hat{\mu_2} }[/math]对应的参数;
(3) 对[math]\displaystyle{ f^{(2)} }[/math]进行尺度缩放和上下左右翻转:[math]\displaystyle{ f^{(2)}(\hat{\mu_2},x)\rightarrow -\alpha f^{(2)}(\hat{\mu_2},-\frac{x}{\alpha}) }[/math](其中[math]\displaystyle{ \alpha }[/math]为一个常数,将从重整化方程的求解过程中确定它的值)。
或者,可以简单地把上述3个步骤写为:
- [math]\displaystyle{ R(f)= -\alpha f^{(2)}(\hat{\mu_2},-\frac{x}{\alpha}) }[/math]
于是从一个函数[math]\displaystyle{ f_1(\hat{\mu_1},x) }[/math]出发,不停地运用变换R,就能得到一个函数序列:
- [math]\displaystyle{ f_1(\hat{\mu_1},x)\rightarrow f_2(\hat{\mu_2},x)\rightarrow f_3(\hat{\mu_3},x)\cdot\cdot\cdot }[/math]
其中任意一项可以写成:
- [math]\displaystyle{ f_{n+1}(\hat{\mu_{n+1}},x)=R(f_n(\hat{\mu_n},x)) }[/math]
在用重整化的方法研究迭代函数的时候,又得到了一个迭代序列,只不过这里面被反复迭代的对象已经不再是数了,而是变成了迭代函数本身。于是,一切就升级了。假设,这一函数的迭代过程也存在着一个不动点,注意这个不动点不是数,而是一个函数,记为:
- [math]\displaystyle{ g(\mu,x)=\lim_{n\rightarrow \infty}f_n(\hat{\mu_{n}},x) }[/math]
那么,它应该满足:
- [math]\displaystyle{ g(\mu,x)=R(g(\mu,x)) }[/math]
再把R具体的定义带进去,就有:
- [math]\displaystyle{ g(\mu,x)=-\alpha g(\mu,g(\mu,-\frac{x}{\alpha})) }[/math]
于是,得到了一个函数方程。它是重整化的不动点方程。对这个方程的求解其他需要求解的量。
重整化方程求解
本文不打算对重整化方程的求解进行详细地讨论,仅展示结论。如果把所有经过重整化方程迭代而收敛到同一个点的函数集合记为一个普适类,就可以解释不同的函数形式也具有相同的费根鲍姆常数的原因。同时将R变换在不动点附近进行泰勒级数展开,并保留线性项,我们就可以计算出费根鲍姆常数[math]\displaystyle{ \delta }[/math]和[math]\displaystyle{ \alpha }[/math]。因此,整个问题就都得到了解答。具体求解可以参考重整化这个词条的方程求解部分。
参见
- Logistic函数,Logistic映射连续对应: 逻辑微分方程
- 李雅普诺夫稳定性 离散时间系统的定义
- 马尔萨斯生长模型
- 复二次映射的周期点,其中Logistic映射是收敛于某一函数值的特殊情形
- 径向基函数网络这说明了Logistic映射的反问题。
- Schröder's equation
- 刚性方程
相关链接
- Logistic映射包含一个Logistic映射的交互式计算机模拟
- 混沌超级教科书介绍混沌和分形的入门读物
- 使用java基于迭代和分岔图的交互式Logistic映射
- 显示定点的Logistic映射
- 混沌与Logistic映射 Elmer G. Wiens
- 复杂性与混沌(有声读物)罗杰怀特。第5章涵盖Logistic映射
- “Logistic映射的历史” ,一种新科学 A New Kind of Science,作者史蒂芬·沃尔夫勒姆 Stephen Wolfram
- 关于周期加倍的普遍性简短历史
- 普·维塔诺维的《宇宙功能并不那么短的历史》
- 乘法耦合2周期的Logistic映射作者:C. Pellicer-Lostao and R. Lopez-Ruiz after work by Ed Pegg Jr
- Wolfram 演示项目
- 用 SAGE 方法研究离散Logistic映射方程
参考文献
- ↑ 1.0 1.1 May, Robert M. (1976). "Simple mathematical models with very complicated dynamics". Nature (journal). 261 (5560): 459–467. Bibcode:1976Natur.261..459M. doi:10.1038/261459a0. hdl:10338.dmlcz/104555. PMID 934280.
- ↑ "Weisstein, Eric W. "Logistic Equation". MathWorld.
- ↑ Zhang, Cheng (October 2010). "Period three begins". Mathematics Magazine. 83: 295–297. doi:10.4169/002557010x521859.
- ↑ Jeffries, Carson; Pérez, José (1982). "Observation of a Pomeau–Manneville intermittent route to chaos in a nonlinear oscillator". Physical Review A. 26 (4): 2117–2122. Bibcode:1982PhRvA..26.2117J. doi:10.1103/PhysRevA.26.2117.
- ↑ 5.0 5.1 May, R. M. (1976). "Simple mathematical models with very complicated dynamics". Nature. 261 (5560): 459–67. Bibcode:1976Natur.261..459M. doi:10.1038/261459a0. hdl:10338.dmlcz/104555. PMID 934280.
- ↑ Baumol, William J.; Benhabib, Jess (February 1989). "Chaos: Significance, Mechanism, and Economic Applications". Journal of Economic Perspectives]]. 3 (1): 77–105. doi:10.1257/jep.3.1.77.
- ↑ 7.0 7.1 Schröder, Ernst (1870). "Über iterierte Funktionen". Math. Ann. 3 (2): 296–322. doi:10.1007/BF01443992.
- ↑ Little, M.; Heesch, D. (2004). "Chaotic root-finding for a small class of polynomials" (PDF). Journal of Difference Equations and Applications. 10 (11): 949–953. arXiv:nlin/0407042. doi:10.1080/10236190412331285351.
- ↑ Lorenz, Edward (1964). "The problem of deducing the climate from the governing equations". Tellus. 16 (February): 1–11.
- ↑ 10.0 10.1 Schröder, Ernst (1870). "Ueber iterirte Functionen". Mathematische Annalen. 3 (2): 296–322. doi:10.1007/BF01443992.
- ↑ Collet, Pierre; Eckmann, Jean-Pierre (1980). Iterated Maps on the Interval as Dynamical Systems. Birkhauser. ISBN 978-3-7643-3026-2. https://archive.org/details/iteratedmapsonin0000coll.
- ↑ 12.0 12.1 Gleick, James (1987). Chaos: Making a New Science. London: Penguin Books. ISBN 978-0-14-009250-9.
- ↑ Jakobson, M. (1981). "Absolutely continuous invariant measures for one-parameter families of one-dimensional maps". Communications in Mathematical Physics. 81 (1): 39–88. Bibcode:1981CMaPh..81...39J. doi:10.1007/BF01941800.
- ↑ Feigenbaum, M. J. (1976) "Universality in complex discrete dynamics", Los Alamos Theoretical Division Annual Report 1975-1976
- ↑ Feigenbaum, Mitchell (1978). "Quantitative universality for a class of nonlinear transformations". Journal of Statistical Physics. 19 (1): 25–52. Bibcode:1978JSP....19...25F. CiteSeerX 10.1.1.418.9339. doi:10.1007/BF01020332.
- ↑ Okulov, A Yu; Oraevskiĭ, A N (1986). "Space–temporal behavior of a light pulse propagating in a nonlinear nondispersive medium". J. Opt. Soc. Am. B. 3 (5): 741–746. Bibcode:1986OSAJB...3..741O. doi:10.1364/JOSAB.3.000741.
- ↑ Okulov, A Yu; Oraevskiĭ, A N (1984). "Regular and stochastic self-modulation in a ring laser with nonlinear element". Soviet Journal of Quantum Electronics. 14 (2): 1235–1237. Bibcode:1984QuEle..14.1235O. doi:10.1070/QE1984v014n09ABEH006171.
编者推荐
相关课程
从混沌开始
本课程中,张江老师将用一套自己搭建的“复杂性阶梯”的框架串联起众多复杂性科学概念,包括混沌、秩序、自催化网络、涌现、混沌边缘、热力学第二定律、分形、网络、自指等等。
本中文词条由趣木木,张江参与编译,思无涯咿呀咿呀审校,薄荷、费米子编辑,欢迎在讨论页面留言。
本词条内容源自wikipedia及公开资料,遵守 CC3.0协议。
